EUR/USD weakens as French election uncertainty, Fed’s hawkish narrative weigh

Quelle Fxstreet
  • EUR/USD declines to 1.0700 as the Euro weakens amid uncertainty over the French elections.
  • ECB policymakers see a bumpy inflation path towards the 2% target.
  • Fed’s maintenance of a hawkish outlook offsets the impact of soft US inflation data.

EUR/USD extends its downside below the round-level support of 1.0700, touching the lowest level in more than a month during Friday’s European session. The major currency pair weakens as the Euro remains under pressure due to deepening French political uncertainty ahead of the upcoming legislative elections. 

The Euro has faced turmoil this week after French President Emmanuel Macron's called for a snap election on Sunday after suffering a defeat from Marine Le Pen's far-right National Rally (RN) in parliamentary elections. There is a slight possibility that the Centralist’s alliance could make a coalition government as the RN party misses an absolute majority, according to recent polls.

On the monetary policy front, European Central Bank (ECB) policymakers continue to push back expectations of subsequent rate cuts as the path towards the 2% inflation target looks bumpy amid concerns over sustained wage growth. 

On Thursday, ECB Governing Council member Bostjan Vasle said that more rate cuts are possible if the disinflation process continues. However, Vasle also warned that the process could slow down as wage momentum is relatively strong.

Daily digest market movers: EUR/USD slides further as Fed sees only one rate cut this year

  • EUR/USD faces intense selling pressure and declines below the round-level support of 1.0700 as the US Dollar (US) strengthens. The US Dollar Index (DXY), which tracks the Greenback’s value against six major currencies, prints a fresh monthly high at 105.55.
  • The US Dollar remains firm as the latest interest rate projections from Federal Reserve (Fed) policymakers indicate that there will be only one rate cut this year against the three cuts forecasted in March. Also, expectations for the core Personal Consumption Expenditure Price Index (PCE) reading, which is the Fed’s preferred inflation measure, were upwardly revised to 2.8% from 2.6%.
  • In Wednesday’s press conference, Fed Chair Jerome Powell acknowledged that soft Consumer Price Index (CPI) report for May is encouraging and indicated that inflation is heading in the right direction. However, to build confidence for rate cuts policymakers want to see inflation declining for months.
  • Contrary to Fed’s communication of one rate cut for this year, market participants expect that there will be two. Investors’ expectations for the Fed lowering interest rates twice this year have strengthened due to the soft CPI and Producer Price Index (PPI) report for May.
  • According to the CME FedWatch tool, 30-day Federal Funds futures pricing data show that the Fed will start reducing interest rates from the September meeting and there will be one more cut in either November or December. The probability of the Fed cutting rates from September has increased to 65% from 50.5% a week ago.
  • The US PPI report showed on Thursday that headline producer inflation unexpectedly contracted by 0.2% on month, while the core reading – which strips off volatile food and energy prices – was unchanged. Annually, headline and core PPI decelerated to 2.2% and 2.3%, respectively.
  • In Friday’s session, investors will focus on the preliminary Michigan Consumer Sentiment Index, which gauges public sentiment towards personal finances, business conditions and buying conditions. The index is expected to have improved to 72.0 from the prior reading of 69.1.

Technical Analysis: EUR/USD declines toward 1.0636

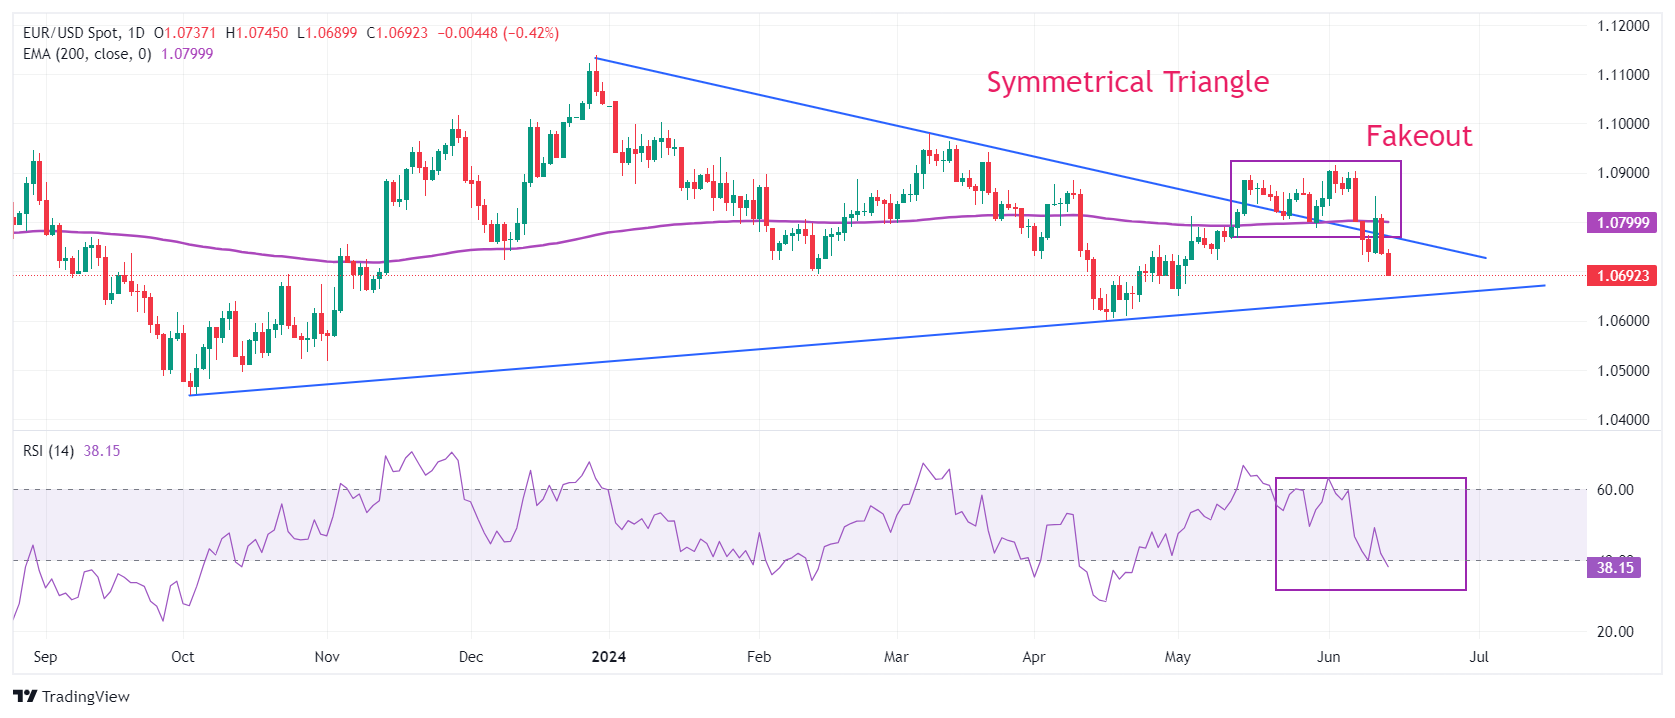
EUR/USD slumps below the round-level support of 1.0700. The major currency pair weakens after failing to hold the Symmetrical Triangle breakout formed on a daily time frame, suggesting that the overall trend has turned bearish. The shared currency pair has now returned inside the triangle formation and is expected to find support at 1.0636, near the upward-sloping order of the chart pattern plotted from 3 October 2023 low at 1.0448.

The long-term outlook of the pair has also turned negative as prices dropped below the 200-day Exponential Moving Average (EMA), which trades around 1.0800.

The 14-day Relative Strength Index (RSI) falls below 40.00. Momentum could turn bearish if the RSI sustains below this level.

Euro FAQs

The Euro is the currency for the 20 European Union countries that belong to the Eurozone. It is the second most heavily traded currency in the world behind the US Dollar. In 2022, it accounted for 31% of all foreign exchange transactions, with an average daily turnover of over $2.2 trillion a day. EUR/USD is the most heavily traded currency pair in the world, accounting for an estimated 30% off all transactions, followed by EUR/JPY (4%), EUR/GBP (3%) and EUR/AUD (2%).

The European Central Bank (ECB) in Frankfurt, Germany, is the reserve bank for the Eurozone. The ECB sets interest rates and manages monetary policy. The ECB’s primary mandate is to maintain price stability, which means either controlling inflation or stimulating growth. Its primary tool is the raising or lowering of interest rates. Relatively high interest rates – or the expectation of higher rates – will usually benefit the Euro and vice versa. The ECB Governing Council makes monetary policy decisions at meetings held eight times a year. Decisions are made by heads of the Eurozone national banks and six permanent members, including the President of the ECB, Christine Lagarde.

Eurozone inflation data, measured by the Harmonized Index of Consumer Prices (HICP), is an important econometric for the Euro. If inflation rises more than expected, especially if above the ECB’s 2% target, it obliges the ECB to raise interest rates to bring it back under control. Relatively high interest rates compared to its counterparts will usually benefit the Euro, as it makes the region more attractive as a place for global investors to park their money.

Data releases gauge the health of the economy and can impact on the Euro. Indicators such as GDP, Manufacturing and Services PMIs, employment, and consumer sentiment surveys can all influence the direction of the single currency. A strong economy is good for the Euro. Not only does it attract more foreign investment but it may encourage the ECB to put up interest rates, which will directly strengthen the Euro. Otherwise, if economic data is weak, the Euro is likely to fall. Economic data for the four largest economies in the euro area (Germany, France, Italy and Spain) are especially significant, as they account for 75% of the Eurozone’s economy.

Another significant data release for the Euro is the Trade Balance. This indicator measures the difference between what a country earns from its exports and what it spends on imports over a given period. If a country produces highly sought after exports then its currency will gain in value purely from the extra demand created from foreign buyers seeking to purchase these goods. Therefore, a positive net Trade Balance strengthens a currency and vice versa for a negative balance.


Haftungsausschluss: Nur zu Informationszwecken. Die bisherige Performance ist kein verlässlicher Indikator für zukünftige Ergebnisse.
placeholder
Silberpreis-Prognose: XAG/USD erholt sich in Richtung 95,00 US-Dollar nahe RekordhöhenDer Silberpreis (XAG/USD) gleicht die Verluste der beiden vorhergehenden Tage aus und handelt während der europäischen Handelsstunden am Donnerstag um die 94,20 USD je Feinunze.
Autor  FXStreet
Do. 22.Jan
Der Silberpreis (XAG/USD) gleicht die Verluste der beiden vorhergehenden Tage aus und handelt während der europäischen Handelsstunden am Donnerstag um die 94,20 USD je Feinunze.
placeholder
Gold setzt Rekord-Rally fort – XAU/USD nähert sich $5,100 mit schwachem USD und anhaltender Safe-Haven-NachfrageGold (XAU/USD) setzt seine Rekord-Rally fort und nähert sich der Marke von $5,100, gestützt von geopolitischen Spannungen, schwachem USD und Zinssenkungserwartungen der Fed; technische Hürden bei $5,099 und Konsolidierungspotenzial bei $4,932.
Autor  Mitrade Team
Mo. 26.Jan
Gold (XAU/USD) setzt seine Rekord-Rally fort und nähert sich der Marke von $5,100, gestützt von geopolitischen Spannungen, schwachem USD und Zinssenkungserwartungen der Fed; technische Hürden bei $5,099 und Konsolidierungspotenzial bei $4,932.
placeholder
Gold hält sich über 5.150 US-Dollar – Anleger warten auf Fed-EntscheidGold (XAU/USD) hält sich vor der Fed-Entscheidung am Mittwoch über 5.150 US-Dollar und steigt in Asien bis nahe 5.160 US-Dollar, gestützt von Dollar-Schwäche, geopolitischen Risiken und der Erwartung einer Zinspause bei 3,50% bis 3,75%.
Autor  Mitrade Team
Gestern 01: 01
Gold (XAU/USD) hält sich vor der Fed-Entscheidung am Mittwoch über 5.150 US-Dollar und steigt in Asien bis nahe 5.160 US-Dollar, gestützt von Dollar-Schwäche, geopolitischen Risiken und der Erwartung einer Zinspause bei 3,50% bis 3,75%.
placeholder
Gold über $5.200: Rekordjagd geht weiter – Fed-Entscheid rückt in den MittelpunktGold (XAU/USD) klettert am achten Tag in Folge über $5.200 auf neue Allzeithochs, gestützt von Safe-Haven-Zuflüssen, Fed-Zinssenkungsfantasie und Sorgen um die Fed-Unabhängigkeit, während technisch der Aufwärtskanal (Support $5,096.12 / Widerstand $5,274.38) bei RSI 77 eine Konsolidierung nahe der Oberkante möglich macht.
Autor  Mitrade Team
Gestern 05: 50
Gold (XAU/USD) klettert am achten Tag in Folge über $5.200 auf neue Allzeithochs, gestützt von Safe-Haven-Zuflüssen, Fed-Zinssenkungsfantasie und Sorgen um die Fed-Unabhängigkeit, während technisch der Aufwärtskanal (Support $5,096.12 / Widerstand $5,274.38) bei RSI 77 eine Konsolidierung nahe der Oberkante möglich macht.
placeholder
Krypto-Ausblick: Bitcoin stabilisiert sich über 87.787 US-Dollar – Ether vor der nächsten Hürde, XRP bleibt fragil• Bitcoin pendelt am Mittwoch um 89.000 US-Dollar und hat sich nach der Vorwochenkorrektur bislang um knapp 3% erholt – entscheidend bleibt die Zone um 87.787 US-Dollar. • Ethereum arbeitet sich an die Widerstandszone heran: Erst ein Tagesschluss über 3.017 US-Dollar und der 50-Tage-EMA bei 3.101 US-Dollar würde den Weg nach oben freimachen. • XRP prallt von 1,83 US-Dollar ab und steht wieder bei 1,90 US-Dollar – doch RSI und MACD sprechen weiter für Vorsicht. Nach der kräftigen Korrektur der vergangenen Woche setzt sich im Kryptomarkt eine vorsichtige Stabilisierung durch. Bitcoin, Ether und XRP bauen ihre Erholung aus, stoßen nun aber auf charttechnisch wichtige Marken, an denen sich entscheidet, ob aus der Gegenbewegung mehr wird – oder ob der nächste Rücksetzer folgt. Bitcoin: 87.787 US-Dollar bleibt der Dreh- und Angelpunkt Bitcoin hat am Montag nach der 7,48%-Korrektur der Vorwoche wieder oberhalb der Mittellinie eines horizontalen Parallelkanals bei 87.787 US-Dollar geschlossen. Am Dienstag verteidigte der Kurs diese Zone erneut, am Mittwoch notiert BTC bei rund 89.300 US-Dollar. Hält 87.787 US-Dollar als Support, rückt die obere Begrenzung des Musters bei 90.000 US-Dollar in den Fokus. Der RSI (Tag) liegt bei 45 und steigt in Richtung der neutralen 50 – ein Hinweis auf nachlassenden Verkaufsdruck. Auch der MACD entspannt sich: Die Linien nähern sich an, die roten Histogrammbalken unterhalb der Nulllinie werden schwächer. Bricht Bitcoin dagegen per Tagesschluss wieder unter 87.787 US-Dollar, bleibt die Unterseite anfällig – dann würde die nächste Auffangzone bei 85.569 US-Dollar (zugleich 78,6% Fibonacci-Retracement) wieder relevant. Ethereum: Erst über 3.017 und 3.101 US-Dollar wird es konstruktiver Ethereum startete positiv in die Woche und legte bis Dienstag um 7,62% zu – nach der 14,22%-Korrektur in der Woche davor. Am Mittwoch nähert sich ETH dem zentralen Widerstand bei 3.017 US-Dollar. Für ein klareres Erholungssignal braucht es mehr als nur Intraday-Stärke: Ein Ausbruch über 3.017 US-Dollar und ein Tagesschluss über dem 50-Tage-EMA bei 3.101 US-Dollar könnten den Blick in Richtung des Hochs vom 14. Januar bei 3.402 US-Dollar lenken. Die Momentum-Indikatoren (RSI und MACD) deuten zwar auf nachlassenden Abwärtsdruck hin, aber das Setup bleibt empfindlich. Kommt es stattdessen zu einer erneuten Abweisung an der Widerstandszone, rückt auf der Unterseite das 61,8% Fibonacci-Retracement bei 2.749 US-Dollar wieder ins Blickfeld. XRP: Rebound ja – Trendwende noch nicht XRP hat am Sonntag die tägliche Unterstützung bei 1,83 US-Dollar getestet und anschließend binnen zwei Tagen um 4,51% zugelegt. Am Mittwoch handelt der Kurs bei 1,90 US-Dollar. Solange 1,83 US-Dollar hält, kann sich die Erholung in Richtung des nächsten Widerstands bei 1,96 US-Dollar fortsetzen. Allerdings ist der Unterton noch nicht gedreht: Der RSI liegt bei 42 und damit weiter unter der neutralen 50. Zudem bleibt das Bild im MACD belastet – das bärische Crossover der Vorwoche ist weiterhin aktiv, was das Rückschlagrisiko erhöht. Fällt XRP per Tagesschluss erneut unter 1,83 US-Dollar, wäre ein weiterer Abwärtsimpuls bis zum Tief vom 19. Dezember bei 1,77 US-Dollar wieder ein realistisches Szenario.
Autor  Mitrade Team
Gestern 06: 37
• Bitcoin pendelt am Mittwoch um 89.000 US-Dollar und hat sich nach der Vorwochenkorrektur bislang um knapp 3% erholt – entscheidend bleibt die Zone um 87.787 US-Dollar. • Ethereum arbeitet sich an die Widerstandszone heran: Erst ein Tagesschluss über 3.017 US-Dollar und der 50-Tage-EMA bei 3.101 US-Dollar würde den Weg nach oben freimachen. • XRP prallt von 1,83 US-Dollar ab und steht wieder bei 1,90 US-Dollar – doch RSI und MACD sprechen weiter für Vorsicht. Nach der kräftigen Korrektur der vergangenen Woche setzt sich im Kryptomarkt eine vorsichtige Stabilisierung durch. Bitcoin, Ether und XRP bauen ihre Erholung aus, stoßen nun aber auf charttechnisch wichtige Marken, an denen sich entscheidet, ob aus der Gegenbewegung mehr wird – oder ob der nächste Rücksetzer folgt. Bitcoin: 87.787 US-Dollar bleibt der Dreh- und Angelpunkt Bitcoin hat am Montag nach der 7,48%-Korrektur der Vorwoche wieder oberhalb der Mittellinie eines horizontalen Parallelkanals bei 87.787 US-Dollar geschlossen. Am Dienstag verteidigte der Kurs diese Zone erneut, am Mittwoch notiert BTC bei rund 89.300 US-Dollar. Hält 87.787 US-Dollar als Support, rückt die obere Begrenzung des Musters bei 90.000 US-Dollar in den Fokus. Der RSI (Tag) liegt bei 45 und steigt in Richtung der neutralen 50 – ein Hinweis auf nachlassenden Verkaufsdruck. Auch der MACD entspannt sich: Die Linien nähern sich an, die roten Histogrammbalken unterhalb der Nulllinie werden schwächer. Bricht Bitcoin dagegen per Tagesschluss wieder unter 87.787 US-Dollar, bleibt die Unterseite anfällig – dann würde die nächste Auffangzone bei 85.569 US-Dollar (zugleich 78,6% Fibonacci-Retracement) wieder relevant. Ethereum: Erst über 3.017 und 3.101 US-Dollar wird es konstruktiver Ethereum startete positiv in die Woche und legte bis Dienstag um 7,62% zu – nach der 14,22%-Korrektur in der Woche davor. Am Mittwoch nähert sich ETH dem zentralen Widerstand bei 3.017 US-Dollar. Für ein klareres Erholungssignal braucht es mehr als nur Intraday-Stärke: Ein Ausbruch über 3.017 US-Dollar und ein Tagesschluss über dem 50-Tage-EMA bei 3.101 US-Dollar könnten den Blick in Richtung des Hochs vom 14. Januar bei 3.402 US-Dollar lenken. Die Momentum-Indikatoren (RSI und MACD) deuten zwar auf nachlassenden Abwärtsdruck hin, aber das Setup bleibt empfindlich. Kommt es stattdessen zu einer erneuten Abweisung an der Widerstandszone, rückt auf der Unterseite das 61,8% Fibonacci-Retracement bei 2.749 US-Dollar wieder ins Blickfeld. XRP: Rebound ja – Trendwende noch nicht XRP hat am Sonntag die tägliche Unterstützung bei 1,83 US-Dollar getestet und anschließend binnen zwei Tagen um 4,51% zugelegt. Am Mittwoch handelt der Kurs bei 1,90 US-Dollar. Solange 1,83 US-Dollar hält, kann sich die Erholung in Richtung des nächsten Widerstands bei 1,96 US-Dollar fortsetzen. Allerdings ist der Unterton noch nicht gedreht: Der RSI liegt bei 42 und damit weiter unter der neutralen 50. Zudem bleibt das Bild im MACD belastet – das bärische Crossover der Vorwoche ist weiterhin aktiv, was das Rückschlagrisiko erhöht. Fällt XRP per Tagesschluss erneut unter 1,83 US-Dollar, wäre ein weiterer Abwärtsimpuls bis zum Tief vom 19. Dezember bei 1,77 US-Dollar wieder ein realistisches Szenario.
verbundene Finanzinstrumente
goTop
quote