

US Dollar sideways with Retail Sales on deck ahead of Fed decision
- The US Dollar trades steady against most major currencies on Tuesday.
- Traders await Wednesday’s Fed decision, with limited reaction expected from the Retail Sales data.
- The US Dollar Index is under selling pressure near the yearly lows ahead of the central bank key event.
The US Dollar (USD) trades flat on Tuesday, with traders sitting on their hands ahead of Wednesday’s main event. The Federal Open Market Committee (FOMC) convenes on Tuesday to debate the upcoming US Federal Reserve’s (Fed) policy decision on Wednesday and how big the initial Fed’s interest rate cut will be. Then, the markets will finally hear from Fed Chairman Jerome Powell at the press conference.
On the economic data front, the Retail Sales are due on Tuesday. Although it is normally very market-moving, expect the reaction to be somewhat subdued, with traders waiting for the Fed meeting outcome before piling into a trade. The only scenario in which a substantial move could happen is if the Retail Sales contracted in August, which would support the case for the Fed to deliver a bigger 0.50% rate cut.
Daily digest market movers: Retail Sales do not create waves
- Retail Sales data for August are due to come out at 12:30 GMT. Monthly Retail Sales are expected to increase by 0.2% after growing by 1.0% in July. Sales excluding Cars and Transportation are expected to marginally move by 0.3%, from 0.4% the prior month.
- At 13:15 GMT, Industrial Production data for August is expected to turn flat at 0.0%, out of contraction of 0.6% in July.
- At 14:00 GMT, Federal Reserve Bank of Dallas President Lorie Logan will deliver welcoming remarks at the Eleventh District Banking Conference in Dallas. Logan isn't expected to talk about monetary policy because the Fed is within its blackout period ahead of its meeting on Wednesday.
- At that same time, 14:00 GMT, the National Association of Home Builders (NAHB) will release September’s Housing Market Index, with a steady 40 expected against the previous reading of 39.
- Japanese equities started their week after the bank holiday on Monday. Both the Topix and the Nikkei are down over 0.50%. European and US equities are looking in another direction and are heading in the green.
- The CME Fedwatch Tool shows a further declining chance of a 25 basis points (bps) interest rate cut by the Fed on Wednesday, by only 33.0%, further down from the 66% seen a week ago. Meanwhile, markets have increased the chances of a 50 bps cut to 67.0%. For the November 7 meeting, another 25 bps cut (if September is a 25 bps cut) is expected by 18.0%, while there is a 52.3% chance that rates will be 75 bps (25 bps + 50 bps) and a 29.7% probability of rates being 100 (25 bps + 75 bps) basis points lower compared to current levels.
- The US 10-year benchmark rate trades at 3.61%, nearing the 15-month low of 3.60%.
Economic Indicator
Retail Sales (MoM)
The Retail Sales data, released by the US Census Bureau on a monthly basis, measures the value in total receipts of retail and food stores in the United States. Monthly percent changes reflect the rate of changes in such sales. A stratified random sampling method is used to select approximately 4,800 retail and food services firms whose sales are then weighted and benchmarked to represent the complete universe of over three million retail and food services firms across the country. The data is adjusted for seasonal variations as well as holiday and trading-day differences, but not for price changes. Retail Sales data is widely followed as an indicator of consumer spending, which is a major driver of the US economy. Generally, a high reading is seen as bullish for the US Dollar (USD), while a low reading is seen as bearish.
Read more.Next release: Tue Sep 17, 2024 12:30
Frequency: Monthly
Consensus: -0.2%
Previous: 1%
Source: US Census Bureau
Retail Sales data published by the US Census Bureau is a leading indicator that gives important information about consumer spending, which has a significant impact on the GDP. Although strong sales figures are likely to boost the USD, external factors, such as weather conditions, could distort the data and paint a misleading picture. In addition to the headline data, changes in the Retail Sales Control Group could trigger a market reaction as it is used to prepare the estimates of Personal Consumption Expenditures for most goods.
US Dollar Index Technical Analysis: Range bound again
The US Dollar Index (DXY) respects the boundaries in which it has been trading during the last month, nearly the yearly lows. A very small bounce is noticeable on the chart, though it is not really running away from that lower band. The risk is that the DXY could snap below it when the Fed delivers its rate cut.
The upper level of the recent range is 101.90. Further up, a steep 1.2% uprising would be needed to get the index to 103.18, with the 55-day Simple Moving Average (SMA) at 102.89 on the way. The next tranche up is very misty, with the 200-day SMA at 103.81 and the 100-day SMA at 103.88, just ahead of the big 104.00 round level.
On the downside, 100.62 (the low from December 28, 2023) holds strong and has already made the DXY rebound two times in recent weeks. Should it break, the low from July 14, 2023, at 99.58, will be the next level to look out for. If that level gives way, early levels from 2023 are coming in near 97.73.
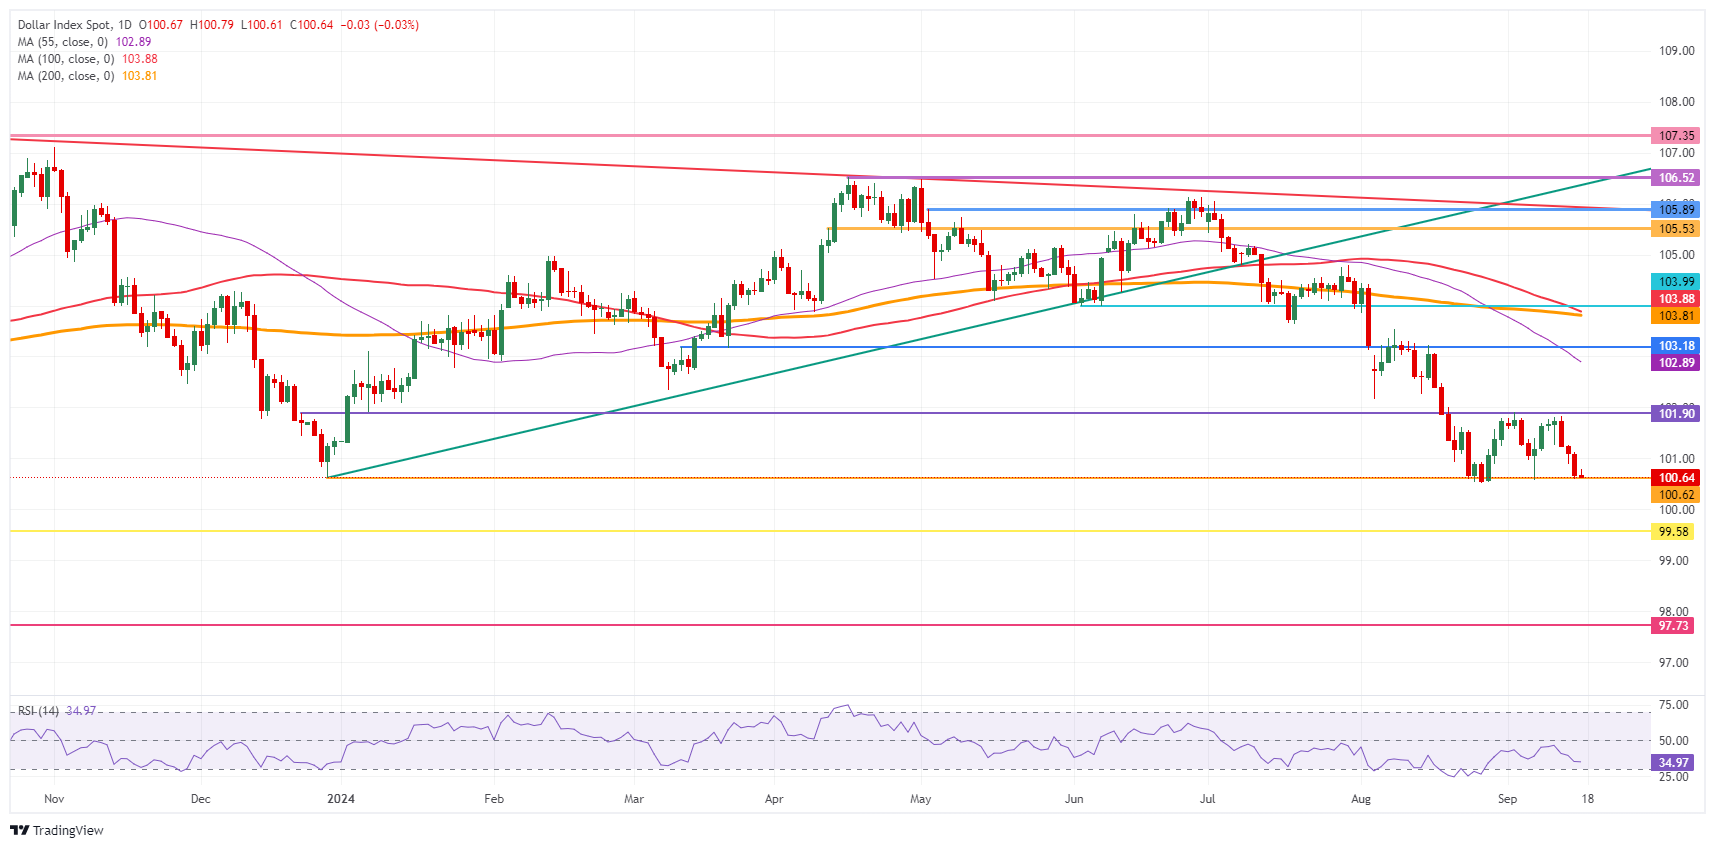
US Dollar Index: Daily Chart
US Dollar FAQs
The US Dollar (USD) is the official currency of the United States of America, and the ‘de facto’ currency of a significant number of other countries where it is found in circulation alongside local notes. It is the most heavily traded currency in the world, accounting for over 88% of all global foreign exchange turnover, or an average of $6.6 trillion in transactions per day, according to data from 2022. Following the second world war, the USD took over from the British Pound as the world’s reserve currency. For most of its history, the US Dollar was backed by Gold, until the Bretton Woods Agreement in 1971 when the Gold Standard went away.
The most important single factor impacting on the value of the US Dollar is monetary policy, which is shaped by the Federal Reserve (Fed). The Fed has two mandates: to achieve price stability (control inflation) and foster full employment. Its primary tool to achieve these two goals is by adjusting interest rates. When prices are rising too quickly and inflation is above the Fed’s 2% target, the Fed will raise rates, which helps the USD value. When inflation falls below 2% or the Unemployment Rate is too high, the Fed may lower interest rates, which weighs on the Greenback.
In extreme situations, the Federal Reserve can also print more Dollars and enact quantitative easing (QE). QE is the process by which the Fed substantially increases the flow of credit in a stuck financial system. It is a non-standard policy measure used when credit has dried up because banks will not lend to each other (out of the fear of counterparty default). It is a last resort when simply lowering interest rates is unlikely to achieve the necessary result. It was the Fed’s weapon of choice to combat the credit crunch that occurred during the Great Financial Crisis in 2008. It involves the Fed printing more Dollars and using them to buy US government bonds predominantly from financial institutions. QE usually leads to a weaker US Dollar.
Quantitative tightening (QT) is the reverse process whereby the Federal Reserve stops buying bonds from financial institutions and does not reinvest the principal from the bonds it holds maturing in new purchases. It is usually positive for the US Dollar.
Empfohlene Artikel


