


Bitcoin price declines 3% as Mt. Gox transfers weigh
- On Tuesday, Mt. Gox transferred 44,527 BTC, equivalent to $2.84 billion, to an internal wallet.
- Micheal Dell, CEO of Dell Technologies, expressed his fascination with Bitcoin on Twitter.
- U.S. spot Bitcoin ETFs saw inflows of $300.90 million on Monday.
- On-chain data shows that $71.02 million short positions were liquidated, and open interest is rising.
Bitcoin (BTC) sees a 3% price decline on Tuesday, trading around the $63,000 level at the time of writing. On-chain data shows a liquidation of $71.02 million in short positions and a rise in open interest. Additionally, US spot Bitcoin ETFs recorded $300.90 million in inflows on Monday. The transfer of 44,527 BTC, valued at $2.84 billion, from Mt. Gox to an internal wallet on Tuesday possibly contributed to market uncertainty, potentially influencing Bitcoin's price drop today.
Daily digest market movers: Bitcoin price sheds 3% as Mt. Gox transfers weigh
- Lookonchain data shows that Mt. Gox transferred 44,527 BTC, equivalent to $2.84 billion, to an internal wallet on Tuesday, possibly in preparation for creditor repayments. With Mt. Gox currently holding 138,985 BTC valued at $8.87 billion, the defunct exchange, famously exploited in 2014, announced plans to reimburse Bitcoin and Bitcoin Cash to users in July. Previously, users suffered nearly $9 billion in cryptocurrency losses. This movement of funds may have triggered FUD (Fear, Uncertainty, Doubt), contributing to Bitcoin's 3% price decline on Tuesday.
Mt. Gox moved 44,527 $BTC(2.84B) to an internal wallet 5 minutes ago, which may be preparing for repayment.#MtGox currently holds 138,985 $BTC($8.87B).https://t.co/f2q66eQNuk pic.twitter.com/JlqkZdzkPC
— Lookonchain (@lookonchain) July 16, 2024
- Michael Dell, the founder and CEO of Dell Technologies, has expressed his fascination with Bitcoin on social media. Dell, with a net worth of approximately $108 billion, shared a recent video of Blackrock CEO Larry Fink discussing Bitcoin on CNBC. This move is significant as Dell's endorsement could influence the tech and finance industries' perception of Bitcoin.
- Given Dell's influence and the scale of Dell Technologies, his interest in Bitcoin could impact its acceptance and further adoption in the US tech industry. In the video, Fink manages $10.5 trillion in assets and explains his shift from skepticism to endorsing Bitcoin as a legitimate "digital gold" and a necessary alternative for economic stability.
Fascinating #Bitcoin pic.twitter.com/LYzl423eBm
— Michael Dell (@MichaelDell) July 15, 2024
- On Monday, US spot Bitcoin ETFs saw inflows of $300.90 million. This indicates increasing investor confidence and may predict a short-term rise in Bitcoin's price. Monitoring the net inflow data of these ETFs is important for grasping market dynamics and investor sentiment. Presently, the combined reserves of Bitcoin held by the 11 US spot Bitcoin ETFs amount to $51.22 billion.
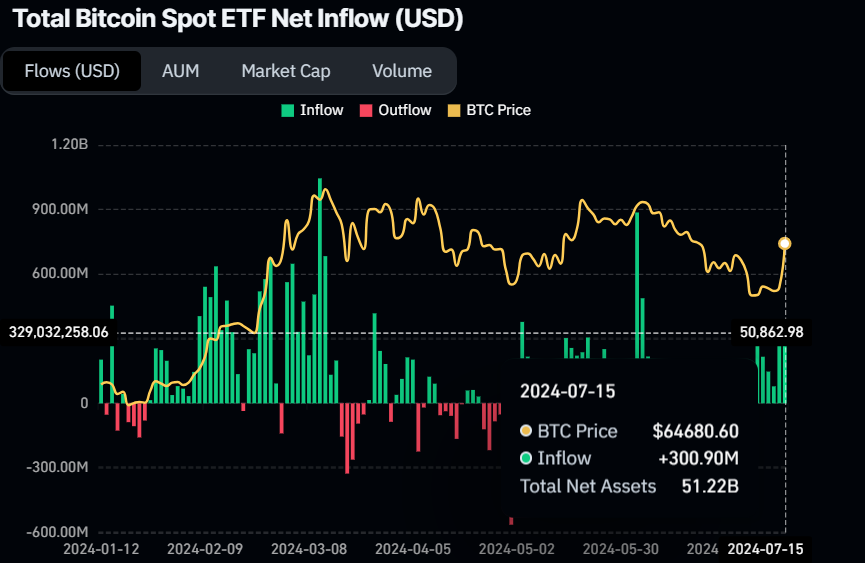
Bitcoin Spot ETF Net Inflow (USD) chart
- According to the Coinglass Bitcoin Total Liquidations chart, $71.02 million in short positions were liquidated on Monday, compared to $9.94 million in long positions. This discrepancy suggests that when more shorts are liquidated than longs, upward pressure on the asset's price often results, driven by short covering, heightened volatility, and potential shifts in market sentiment towards a more bullish outlook.
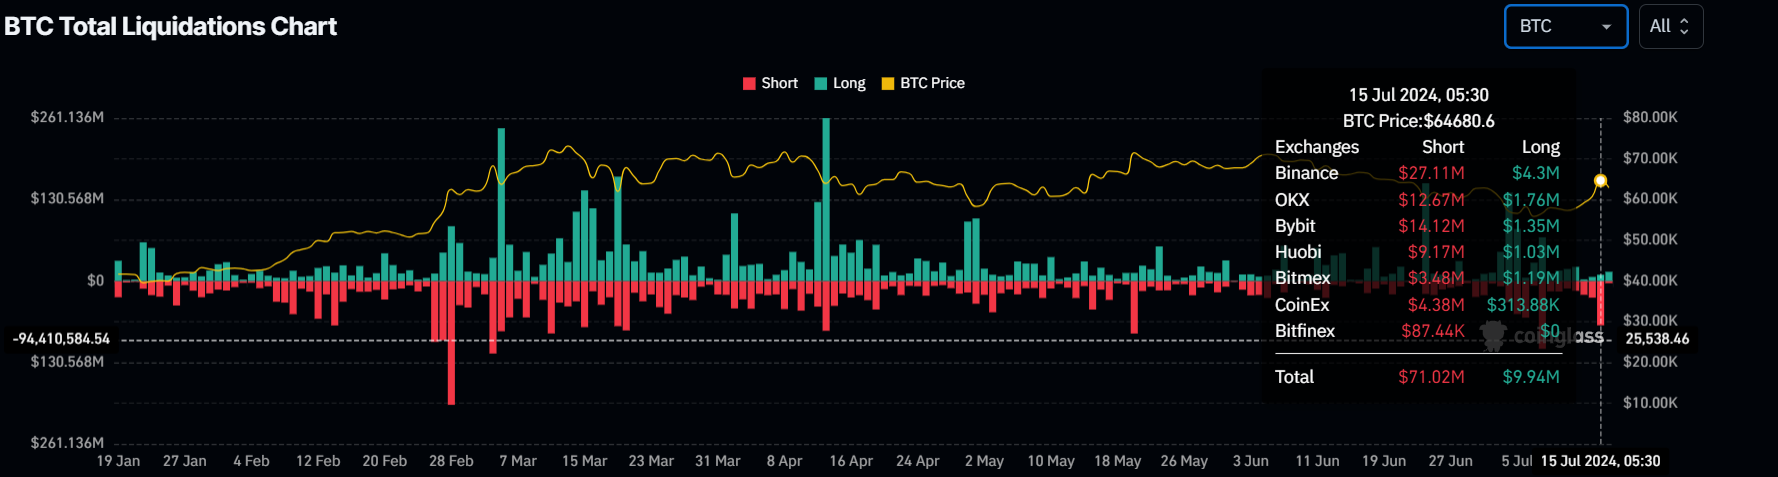
Bitcoin Liquidation chart
- Additionally, Biticoin's Open Interest (OI) chart shows that OI surged from $30.63 billion on Monday to $32.44 billion on Tuesday, reaching its highest level since July 4. This uptick indicates an influx of new capital and increased buying activity within the market.
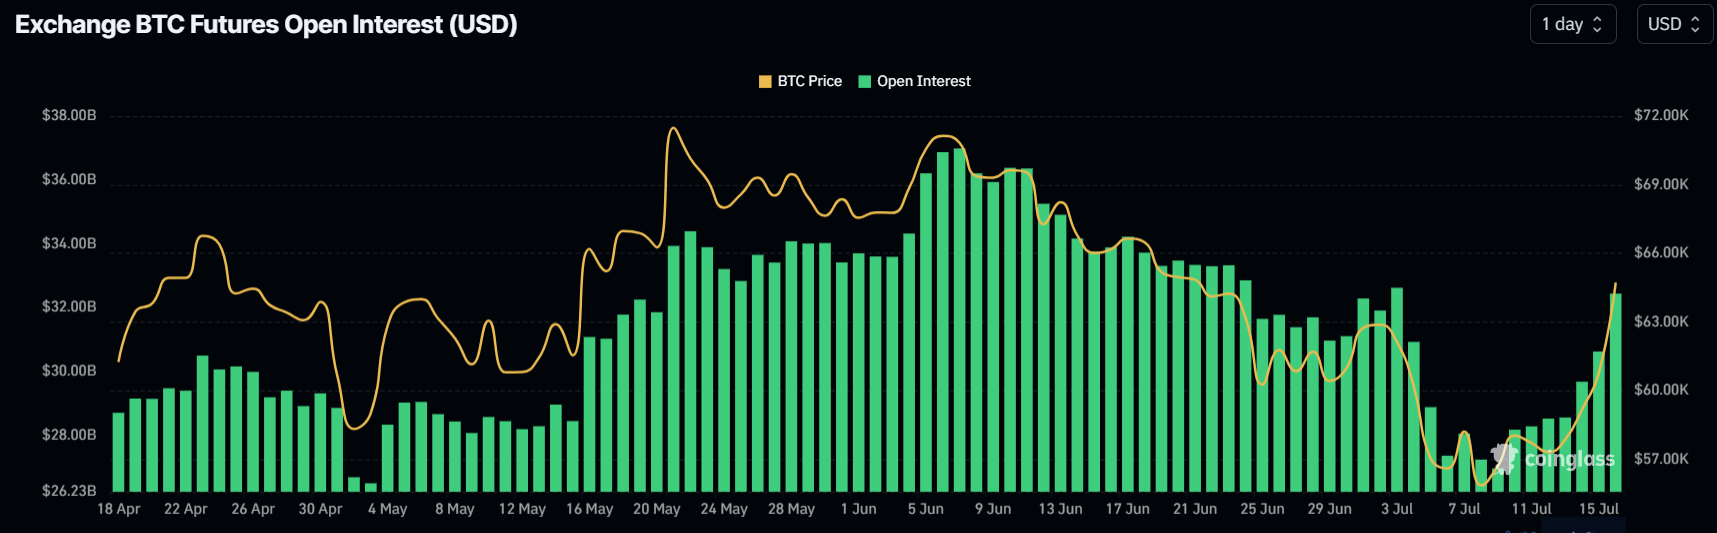
Bitcoin Open Interest chart
Technical analysis: BTC faces resistance around $65,000 level
Bitcoin price broke above a descending trendline on Sunday and rallied 6.5% the next day.When writing, BTC has faced resistance around the daily resistance level of $64,913 and trades down 3% around $62,641.
Sideline buyers looking for opportunities can do so between the $59,200 and $57,800 levels, the broken trendline resistance turned support.
If the trendline holds as throwback support, BTC could rally 10% from that level, targeting its daily resistance of $64,913.
On the daily chart, the Relative Strength Index (RSI) is currently above the neutral level of 50, and the Awesome Oscillator (AO) is also approaching its neutral threshold. Both indicators must maintain their positions above the medium line for the bullish momentum to be sustained. This scenario would contribute additional momentum to the ongoing recovery rally.
Furthermore, surpassing the $64,913 level could allow an additional 3.5% rise to retest the weekly resistance at the $67,209 level.
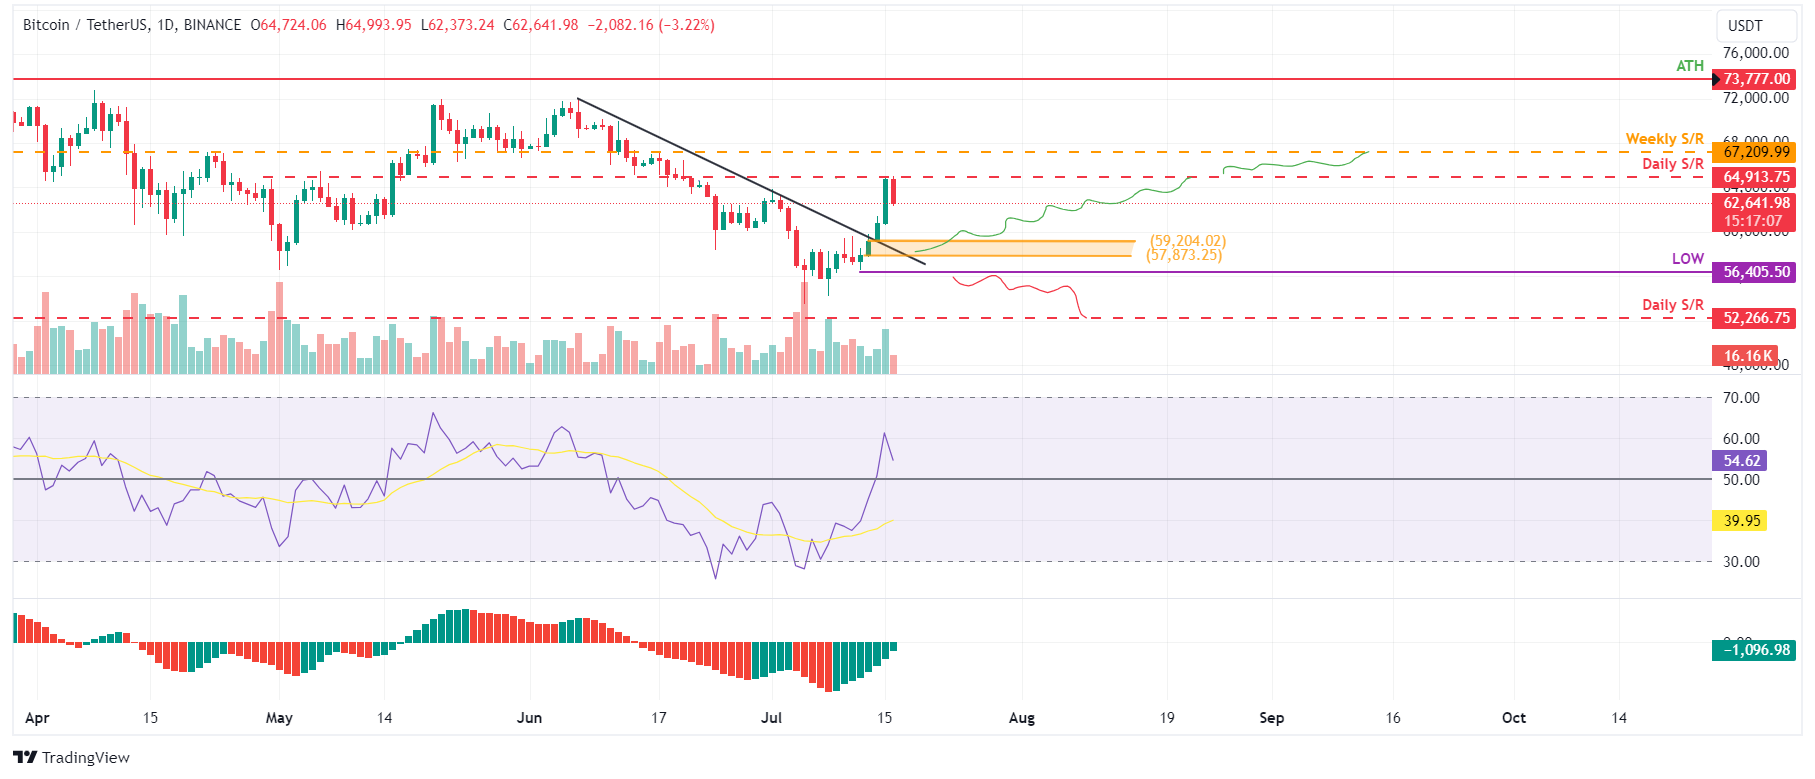
BTC/USDT daily chart
However, If Bitcoin's daily candlestick closes below the $56,405 level and forms a lower low in the daily timeframe, it may signal persistent bearish sentiment. This scenario could trigger a 7.5% decline in Bitcoin's price, targeting its daily support at $52,266.
Bitcoin, altcoins, stablecoins FAQs
Bitcoin is the largest cryptocurrency by market capitalization, a virtual currency designed to serve as money. This form of payment cannot be controlled by any one person, group, or entity, which eliminates the need for third-party participation during financial transactions.
Altcoins are any cryptocurrency apart from Bitcoin, but some also regard Ethereum as a non-altcoin because it is from these two cryptocurrencies that forking happens. If this is true, then Litecoin is the first altcoin, forked from the Bitcoin protocol and, therefore, an “improved” version of it.
Stablecoins are cryptocurrencies designed to have a stable price, with their value backed by a reserve of the asset it represents. To achieve this, the value of any one stablecoin is pegged to a commodity or financial instrument, such as the US Dollar (USD), with its supply regulated by an algorithm or demand. The main goal of stablecoins is to provide an on/off-ramp for investors willing to trade and invest in cryptocurrencies. Stablecoins also allow investors to store value since cryptocurrencies, in general, are subject to volatility.
Bitcoin dominance is the ratio of Bitcoin's market capitalization to the total market capitalization of all cryptocurrencies combined. It provides a clear picture of Bitcoin’s interest among investors. A high BTC dominance typically happens before and during a bull run, in which investors resort to investing in relatively stable and high market capitalization cryptocurrency like Bitcoin. A drop in BTC dominance usually means that investors are moving their capital and/or profits to altcoins in a quest for higher returns, which usually triggers an explosion of altcoin rallies.
Empfohlene Artikel


