Gold price posts modest gains on weaker US Dollar, investors await US key data

Quelle Fxstreet
  • Gold price gains momentum in Tuesday’s early Asian session. 
  • The weaker USD and ongoing Middle East geopolitical tensions support the precious metal. 
  • Traders will monitor the US CB Consumer Confidence and the speeches from the Fed’s Kashkari, Daly and Cook on Tuesday. 

Gold price (XAU/USD) edges higher on Tuesday after bouncing off two-week lows of $2,325. The uptick of yellow metal is bolstered by the softer US Dollar (USD) and safe-haven flows amid the ongoing geopolitical tensions in the Middle East. On the other hand, higher short-term Treasury yields following hawkish Fed minutes and stronger US economic data are likely to support the Greenback in the near term. Traders might prefer to wait on the sidelines ahead of the key US inflation data this week. 

The US Conference Board’s Consumer Confidence is due on Tuesday, along with the Fed’s Neel Kashkari, Mary Daly and Lisa Cook speeches. The US Core Personal Consumption Expenditures Price Index (Core CPE) will take center stage on Friday. More hawkish comments from Fed officials and any signs of sticky inflation, traders might shift back the prospects of the first Fed rate cut. This, in turn, is likely to boost the USD and exert some selling pressure on the USD-denominated gold price.  

Daily digest market movers: Gold price remains strong amid Fed’s hawkish comments and stronger US data

  • An Israeli airstrike triggered a fire that killed 45 people in a tent camp in the Gazan city of Rafah, officials said on Monday. Global leaders called for the implementation of a World Court order to halt Israel's attacks, per Reuters. 
  • According to the recent Fed meeting minutes, the central bank would take longer than anticipated to gain greater confidence in inflation moving to the 2% target. 
  • Traders have reduced their bets on interest rate reduction by the US Federal Reserve (Fed) to 49% odds in September, down from 63% a week earlier, according to the CME FedWatch tool.
  • The preliminary US Gross Domestic Product (GDP) Annualized is estimated to grow 1.4% in Q1 from 1.6% in the previous reading. 
  • The US Core Personal Consumption Expenditures Price Index (Core PCE), the Fed’s preferred inflation gauge, is expected to show an increase of 0.3% MoM and 2.8% YoY in April. 
  • UBS analysts raised their gold price projection to $2,600 by the end of 2024. Citi experts forecast that gold will reach $3,000 per ounce during the next six to eighteen months.

Technical analysis: Gold price maintains a positive stance in the long term

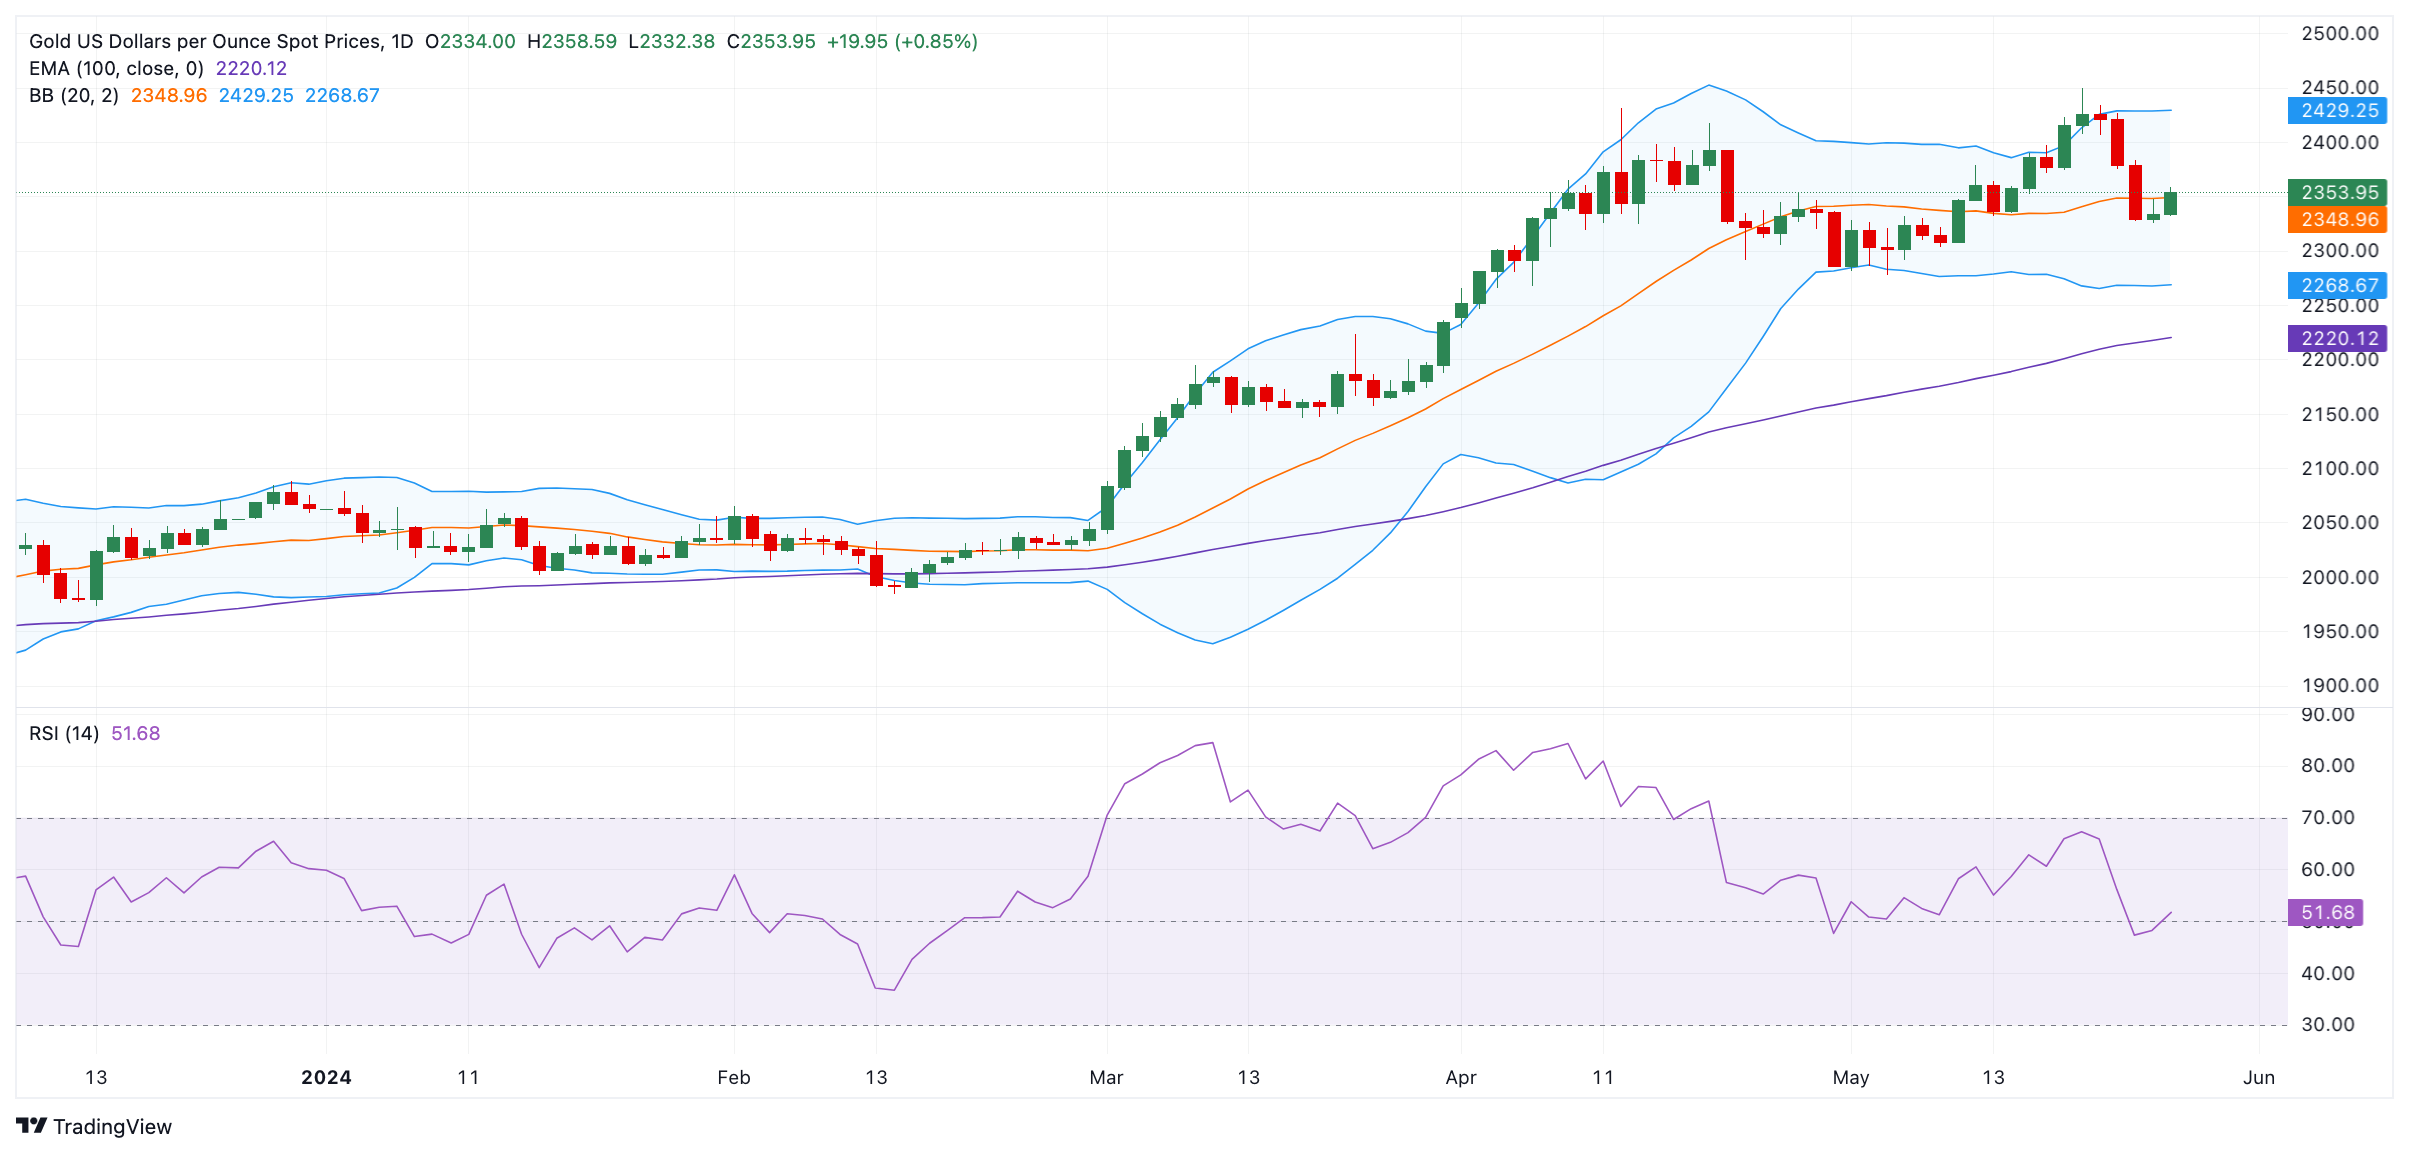
The gold price trades on a positive note on the day. According to the 1-hour chart, the precious metal keeps the bullish vibe unchanged as it holds above the key 100-day Exponential Moving Average (EMA). Nonetheless, the 14-day Relative Strength Index (RSI) hovers around the 50-midline, indicating a neutral level or balance between bullish and bearish positions, which means consolidation or directionlessness cannot be ruled out. 

The upper boundary of the Bollinger Band at $2,430 acts as an immediate resistance level for XAU/USD. Any follow-through buying above the mentioned level will attract some buyers to the all-time high of $2,450 and then the $2,500 psychological barrier. 

In the bearish environment, the first downside target will emerge near the $2,300 round mark. A breach of this level could drag the yellow metal lower to $2,268, followed by the 100-day EMA of $2,220. 

US Dollar price today

The table below shows the percentage change of US Dollar (USD) against listed major currencies today. US Dollar was the weakest against the Swiss Franc.

  USD EUR GBP CAD AUD JPY NZD CHF
USD   -0.03% -0.01% -0.01% -0.03% -0.01% -0.05% -0.07%
EUR 0.03%   0.02% 0.01% 0.00% 0.02% -0.02% -0.03%
GBP 0.00% -0.02%   -0.01% -0.02% 0.01% -0.04% -0.05%
CAD 0.01% -0.01% -0.01%   -0.01% 0.01% -0.03% -0.04%
AUD 0.03% 0.00% 0.02% 0.01%   0.02% -0.02% -0.03%
JPY 0.00% -0.03% -0.02% -0.01% -0.04%   -0.06% -0.05%
NZD 0.05% 0.02% 0.04% 0.03% 0.02% 0.05%   0.00%
CHF 0.05% 0.03% 0.05% 0.05% 0.06% 0.05% 0.01%  

The heat map shows percentage changes of major currencies against each other. The base currency is picked from the left column, while the quote currency is picked from the top row. For example, if you pick the Euro from the left column and move along the horizontal line to the Japanese Yen, the percentage change displayed in the box will represent EUR (base)/JPY (quote).

Gold FAQs

Gold has played a key role in human’s history as it has been widely used as a store of value and medium of exchange. Currently, apart from its shine and usage for jewelry, the precious metal is widely seen as a safe-haven asset, meaning that it is considered a good investment during turbulent times. Gold is also widely seen as a hedge against inflation and against depreciating currencies as it doesn’t rely on any specific issuer or government.

Central banks are the biggest Gold holders. In their aim to support their currencies in turbulent times, central banks tend to diversify their reserves and buy Gold to improve the perceived strength of the economy and the currency. High Gold reserves can be a source of trust for a country’s solvency. Central banks added 1,136 tonnes of Gold worth around $70 billion to their reserves in 2022, according to data from the World Gold Council. This is the highest yearly purchase since records began. Central banks from emerging economies such as China, India and Turkey are quickly increasing their Gold reserves.

Gold has an inverse correlation with the US Dollar and US Treasuries, which are both major reserve and safe-haven assets. When the Dollar depreciates, Gold tends to rise, enabling investors and central banks to diversify their assets in turbulent times. Gold is also inversely correlated with risk assets. A rally in the stock market tends to weaken Gold price, while sell-offs in riskier markets tend to favor the precious metal.

The price can move due to a wide range of factors. Geopolitical instability or fears of a deep recession can quickly make Gold price escalate due to its safe-haven status. As a yield-less asset, Gold tends to rise with lower interest rates, while higher cost of money usually weighs down on the yellow metal. Still, most moves depend on how the US Dollar (USD) behaves as the asset is priced in dollars (XAU/USD). A strong Dollar tends to keep the price of Gold controlled, whereas a weaker Dollar is likely to push Gold prices up.


Haftungsausschluss: Nur zu Informationszwecken. Die bisherige Performance ist kein verlässlicher Indikator für zukünftige Ergebnisse.
placeholder
Silberpreis-Prognose: XAG/USD erholt sich in Richtung 95,00 US-Dollar nahe RekordhöhenDer Silberpreis (XAG/USD) gleicht die Verluste der beiden vorhergehenden Tage aus und handelt während der europäischen Handelsstunden am Donnerstag um die 94,20 USD je Feinunze.
Autor  FXStreet
Do. 22.Jan
Der Silberpreis (XAG/USD) gleicht die Verluste der beiden vorhergehenden Tage aus und handelt während der europäischen Handelsstunden am Donnerstag um die 94,20 USD je Feinunze.
placeholder
Gold setzt Rekord-Rally fort – XAU/USD nähert sich $5,100 mit schwachem USD und anhaltender Safe-Haven-NachfrageGold (XAU/USD) setzt seine Rekord-Rally fort und nähert sich der Marke von $5,100, gestützt von geopolitischen Spannungen, schwachem USD und Zinssenkungserwartungen der Fed; technische Hürden bei $5,099 und Konsolidierungspotenzial bei $4,932.
Autor  Mitrade Team
Mo. 26.Jan
Gold (XAU/USD) setzt seine Rekord-Rally fort und nähert sich der Marke von $5,100, gestützt von geopolitischen Spannungen, schwachem USD und Zinssenkungserwartungen der Fed; technische Hürden bei $5,099 und Konsolidierungspotenzial bei $4,932.
placeholder
Silber nach Rekordlauf leicht zurück: XAG/USD bleibt bullish, aber Momentum ist überdehntSilber (XAG/USD) erreicht am Montag ein Rekordhoch bei $109.46 und konsolidiert um $108.80, während der Aufwärtskanal und die Spreizung zwischen 9- und 50-Tage-EMA den Trend stützen, der überkaufte RSI 80.24 jedoch eine kurzfristige Pause wahrscheinlicher macht.
Autor  Mitrade Team
Mo. 26.Jan
Silber (XAG/USD) erreicht am Montag ein Rekordhoch bei $109.46 und konsolidiert um $108.80, während der Aufwärtskanal und die Spreizung zwischen 9- und 50-Tage-EMA den Trend stützen, der überkaufte RSI 80.24 jedoch eine kurzfristige Pause wahrscheinlicher macht.
placeholder
Gold hält sich über 5.150 US-Dollar – Anleger warten auf Fed-EntscheidGold (XAU/USD) hält sich vor der Fed-Entscheidung am Mittwoch über 5.150 US-Dollar und steigt in Asien bis nahe 5.160 US-Dollar, gestützt von Dollar-Schwäche, geopolitischen Risiken und der Erwartung einer Zinspause bei 3,50% bis 3,75%.
Autor  Mitrade Team
Gestern 01: 01
Gold (XAU/USD) hält sich vor der Fed-Entscheidung am Mittwoch über 5.150 US-Dollar und steigt in Asien bis nahe 5.160 US-Dollar, gestützt von Dollar-Schwäche, geopolitischen Risiken und der Erwartung einer Zinspause bei 3,50% bis 3,75%.
placeholder
Krypto-Ausblick: Bitcoin stabilisiert sich über 87.787 US-Dollar – Ether vor der nächsten Hürde, XRP bleibt fragil• Bitcoin pendelt am Mittwoch um 89.000 US-Dollar und hat sich nach der Vorwochenkorrektur bislang um knapp 3% erholt – entscheidend bleibt die Zone um 87.787 US-Dollar. • Ethereum arbeitet sich an die Widerstandszone heran: Erst ein Tagesschluss über 3.017 US-Dollar und der 50-Tage-EMA bei 3.101 US-Dollar würde den Weg nach oben freimachen. • XRP prallt von 1,83 US-Dollar ab und steht wieder bei 1,90 US-Dollar – doch RSI und MACD sprechen weiter für Vorsicht. Nach der kräftigen Korrektur der vergangenen Woche setzt sich im Kryptomarkt eine vorsichtige Stabilisierung durch. Bitcoin, Ether und XRP bauen ihre Erholung aus, stoßen nun aber auf charttechnisch wichtige Marken, an denen sich entscheidet, ob aus der Gegenbewegung mehr wird – oder ob der nächste Rücksetzer folgt. Bitcoin: 87.787 US-Dollar bleibt der Dreh- und Angelpunkt Bitcoin hat am Montag nach der 7,48%-Korrektur der Vorwoche wieder oberhalb der Mittellinie eines horizontalen Parallelkanals bei 87.787 US-Dollar geschlossen. Am Dienstag verteidigte der Kurs diese Zone erneut, am Mittwoch notiert BTC bei rund 89.300 US-Dollar. Hält 87.787 US-Dollar als Support, rückt die obere Begrenzung des Musters bei 90.000 US-Dollar in den Fokus. Der RSI (Tag) liegt bei 45 und steigt in Richtung der neutralen 50 – ein Hinweis auf nachlassenden Verkaufsdruck. Auch der MACD entspannt sich: Die Linien nähern sich an, die roten Histogrammbalken unterhalb der Nulllinie werden schwächer. Bricht Bitcoin dagegen per Tagesschluss wieder unter 87.787 US-Dollar, bleibt die Unterseite anfällig – dann würde die nächste Auffangzone bei 85.569 US-Dollar (zugleich 78,6% Fibonacci-Retracement) wieder relevant. Ethereum: Erst über 3.017 und 3.101 US-Dollar wird es konstruktiver Ethereum startete positiv in die Woche und legte bis Dienstag um 7,62% zu – nach der 14,22%-Korrektur in der Woche davor. Am Mittwoch nähert sich ETH dem zentralen Widerstand bei 3.017 US-Dollar. Für ein klareres Erholungssignal braucht es mehr als nur Intraday-Stärke: Ein Ausbruch über 3.017 US-Dollar und ein Tagesschluss über dem 50-Tage-EMA bei 3.101 US-Dollar könnten den Blick in Richtung des Hochs vom 14. Januar bei 3.402 US-Dollar lenken. Die Momentum-Indikatoren (RSI und MACD) deuten zwar auf nachlassenden Abwärtsdruck hin, aber das Setup bleibt empfindlich. Kommt es stattdessen zu einer erneuten Abweisung an der Widerstandszone, rückt auf der Unterseite das 61,8% Fibonacci-Retracement bei 2.749 US-Dollar wieder ins Blickfeld. XRP: Rebound ja – Trendwende noch nicht XRP hat am Sonntag die tägliche Unterstützung bei 1,83 US-Dollar getestet und anschließend binnen zwei Tagen um 4,51% zugelegt. Am Mittwoch handelt der Kurs bei 1,90 US-Dollar. Solange 1,83 US-Dollar hält, kann sich die Erholung in Richtung des nächsten Widerstands bei 1,96 US-Dollar fortsetzen. Allerdings ist der Unterton noch nicht gedreht: Der RSI liegt bei 42 und damit weiter unter der neutralen 50. Zudem bleibt das Bild im MACD belastet – das bärische Crossover der Vorwoche ist weiterhin aktiv, was das Rückschlagrisiko erhöht. Fällt XRP per Tagesschluss erneut unter 1,83 US-Dollar, wäre ein weiterer Abwärtsimpuls bis zum Tief vom 19. Dezember bei 1,77 US-Dollar wieder ein realistisches Szenario.
Autor  Mitrade Team
Gestern 06: 37
• Bitcoin pendelt am Mittwoch um 89.000 US-Dollar und hat sich nach der Vorwochenkorrektur bislang um knapp 3% erholt – entscheidend bleibt die Zone um 87.787 US-Dollar. • Ethereum arbeitet sich an die Widerstandszone heran: Erst ein Tagesschluss über 3.017 US-Dollar und der 50-Tage-EMA bei 3.101 US-Dollar würde den Weg nach oben freimachen. • XRP prallt von 1,83 US-Dollar ab und steht wieder bei 1,90 US-Dollar – doch RSI und MACD sprechen weiter für Vorsicht. Nach der kräftigen Korrektur der vergangenen Woche setzt sich im Kryptomarkt eine vorsichtige Stabilisierung durch. Bitcoin, Ether und XRP bauen ihre Erholung aus, stoßen nun aber auf charttechnisch wichtige Marken, an denen sich entscheidet, ob aus der Gegenbewegung mehr wird – oder ob der nächste Rücksetzer folgt. Bitcoin: 87.787 US-Dollar bleibt der Dreh- und Angelpunkt Bitcoin hat am Montag nach der 7,48%-Korrektur der Vorwoche wieder oberhalb der Mittellinie eines horizontalen Parallelkanals bei 87.787 US-Dollar geschlossen. Am Dienstag verteidigte der Kurs diese Zone erneut, am Mittwoch notiert BTC bei rund 89.300 US-Dollar. Hält 87.787 US-Dollar als Support, rückt die obere Begrenzung des Musters bei 90.000 US-Dollar in den Fokus. Der RSI (Tag) liegt bei 45 und steigt in Richtung der neutralen 50 – ein Hinweis auf nachlassenden Verkaufsdruck. Auch der MACD entspannt sich: Die Linien nähern sich an, die roten Histogrammbalken unterhalb der Nulllinie werden schwächer. Bricht Bitcoin dagegen per Tagesschluss wieder unter 87.787 US-Dollar, bleibt die Unterseite anfällig – dann würde die nächste Auffangzone bei 85.569 US-Dollar (zugleich 78,6% Fibonacci-Retracement) wieder relevant. Ethereum: Erst über 3.017 und 3.101 US-Dollar wird es konstruktiver Ethereum startete positiv in die Woche und legte bis Dienstag um 7,62% zu – nach der 14,22%-Korrektur in der Woche davor. Am Mittwoch nähert sich ETH dem zentralen Widerstand bei 3.017 US-Dollar. Für ein klareres Erholungssignal braucht es mehr als nur Intraday-Stärke: Ein Ausbruch über 3.017 US-Dollar und ein Tagesschluss über dem 50-Tage-EMA bei 3.101 US-Dollar könnten den Blick in Richtung des Hochs vom 14. Januar bei 3.402 US-Dollar lenken. Die Momentum-Indikatoren (RSI und MACD) deuten zwar auf nachlassenden Abwärtsdruck hin, aber das Setup bleibt empfindlich. Kommt es stattdessen zu einer erneuten Abweisung an der Widerstandszone, rückt auf der Unterseite das 61,8% Fibonacci-Retracement bei 2.749 US-Dollar wieder ins Blickfeld. XRP: Rebound ja – Trendwende noch nicht XRP hat am Sonntag die tägliche Unterstützung bei 1,83 US-Dollar getestet und anschließend binnen zwei Tagen um 4,51% zugelegt. Am Mittwoch handelt der Kurs bei 1,90 US-Dollar. Solange 1,83 US-Dollar hält, kann sich die Erholung in Richtung des nächsten Widerstands bei 1,96 US-Dollar fortsetzen. Allerdings ist der Unterton noch nicht gedreht: Der RSI liegt bei 42 und damit weiter unter der neutralen 50. Zudem bleibt das Bild im MACD belastet – das bärische Crossover der Vorwoche ist weiterhin aktiv, was das Rückschlagrisiko erhöht. Fällt XRP per Tagesschluss erneut unter 1,83 US-Dollar, wäre ein weiterer Abwärtsimpuls bis zum Tief vom 19. Dezember bei 1,77 US-Dollar wieder ein realistisches Szenario.
verbundene Finanzinstrumente
goTop
quote