Canada CPI set to show easing price pressures, bolstering BoC to further ease policy

Quelle Fxstreet
  • The Canadian Consumer Price Index is expected to lose further traction in August.
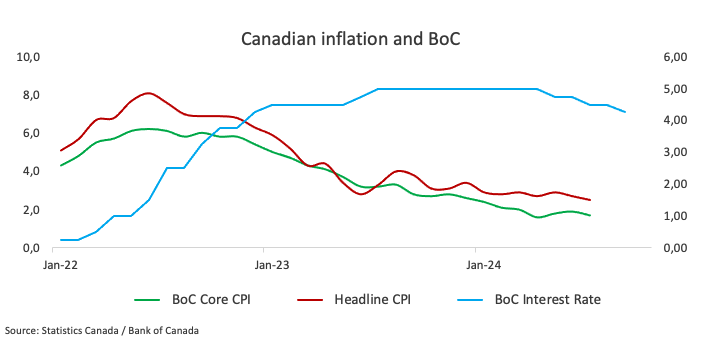
  • The Bank of Canada has reduced its policy rate by 75 bps so far this year.
  • The Canadian Dollar seems to have embarked on a consolidative phase.

Canada is set to release the latest inflation data on Tuesday, with Statistics Canada publishing the Consumer Price Index (CPI) figures for July. Projections indicate a continuation of disinflationary trends in both the headline and the core CPI.

In addition to the headline CPI data, the Bank of Canada (BoC) will release its core CPI, which excludes volatile items such as food and energy. In July, the BoC's core CPI showed a 0.3% gain from July and a 1.7% increase over the past year. Meanwhile, the headline CPI rose by 2.5% over the last 12 months, the lowest level in the last 40 months and 0.4% from a month earlier.

These figures are being closely watched, as they could affect the Canadian Dollar (CAD) in the near term via the Bank of Canada's monetary policy, particularly following the central bank's additional 25-basis-point cut to its policy rate earlier in the month, bringing it to 4.25%.

In the FX market, the Canadian Dollar remains sidelined below 1.3600, a region also coincident with the key 200-day SMA. The ongoing rangebound theme follows monthly peaks in the 1.3625-1.3620 band recorded on September 11.

What can we expect from Canada’s inflation rate?

Analysts expect price pressure in Canada to continue their downward trend in August, although they are still likely to remain above the Bank of Canada's target. However, the persistence of disinflationary pressure should lead the BoC to maintain its easing cycle unchanged at its upcoming meetings. It is worth recalling that the central bank has already lowered its interest rate by 75 bps since it started its easing cycle earlier in the year.

Following the BoC’s rate cut on September 4, Governor Tiff Macklem noted that a 25 bps rate cut was appropriate, although a larger rate cut could be considered in case the economy was weaker than expected.

Regarding inflation, BoC Governor Tiff Macklem argued in a speech to the Canada-UK Chamber of Commerce in London on September 10 that global trade disruptions could make it more challenging for the central bank to consistently achieve its 2% inflation target. He explained that the BoC would need to balance the risks of controlling rising prices while supporting economic growth. 

Macklem noted that with globalization slowing down, the cost of global goods might not decrease as much as before, potentially leading to increased upward pressure on inflation. He mentioned that "trade disruptions may also increase the variability of inflation," pointing out the impact that supply shocks can have on prices. He added that such disruptions could result in "larger deviations of inflation from the 2% target." Consequently, he said the Bank of Canada is focussing on risk management to balance inflation and economic growth and is investing in efforts to better understand global supply chains.

Analysts at TD Securities noted, “Base effects will contribute to a sharp (0.4pp) deceleration for headline CPI alongside further progress on core measures as softer energy prices and seasonal headwinds hold prices unchanged m/m”.

When is the Canada CPI data due, and how could it affect USD/CAD?

Canada is set to release its July CPI on Tuesday at 12:30 GMT. The Canadian Dollar's reaction will largely depend on how the data impacts expectations for the Bank of Canada's (BoC) monetary policy. Unless the figures contain significant surprises, the BoC is anticipated to maintain its current easing approach.

USD/CAD started the month with a decent upward bias, reaching monthly highs around 1.3620 last week. The monthly advance has so far been on the back of further depreciation of the Canadian currency, which has been losing momentum since the August tops near 1.3440 vs. the US Dollar (USD).

Pablo Piovano, a senior analyst at FXStreet, points out that USD/CAD appears well-supported around the critical 200-day Simple Moving Average (SMA) near 1.3590. A break below this level could trigger further weakness, potentially targeting the next support level at the August bottom of 1.3436 (August 28), just ahead of the March low of 1.3419 (March 8), and the weekly low of 1.3358 (January 31).

On the upside, Pablo notes that immediate resistance is located at the September peak of 1.3622 (September 11). The breakout of this region could expose provisional barriers at the 55-day and 100-day SMAs of 1.3659 and 1.3664, respectively, prior to the 2024 top of 1.3946 (August 5).

Pablo also mentioned that any significant increases in CAD volatility would likely hinge on unexpected CPI results. If inflation data comes in below expectations, it could strengthen the case for another BoC interest rate cut at the next meeting, potentially leading to a rise in USD/CAD. Conversely, if inflation exceeds expectations, the Canadian Dollar might experience only modest gains.

Economic Indicator

Consumer Price Index (YoY)

The Consumer Price Index (CPI), released by Statistics Canada on a monthly basis, represents changes in prices for Canadian consumers by comparing the cost of a fixed basket of goods and services. The YoY reading compares prices in the reference month to the same month a year earlier. Generally, a high reading is seen as bullish for the Canadian Dollar (CAD), while a low reading is seen as bearish.

Read more.

Last release: Tue Aug 20, 2024 12:30

Frequency: Monthly

Actual: 2.5%

Consensus: 2.5%

Previous: 2.7%

Source: Statistics Canada

Inflation FAQs

Inflation measures the rise in the price of a representative basket of goods and services. Headline inflation is usually expressed as a percentage change on a month-on-month (MoM) and year-on-year (YoY) basis. Core inflation excludes more volatile elements such as food and fuel which can fluctuate because of geopolitical and seasonal factors. Core inflation is the figure economists focus on and is the level targeted by central banks, which are mandated to keep inflation at a manageable level, usually around 2%.

The Consumer Price Index (CPI) measures the change in prices of a basket of goods and services over a period of time. It is usually expressed as a percentage change on a month-on-month (MoM) and year-on-year (YoY) basis. Core CPI is the figure targeted by central banks as it excludes volatile food and fuel inputs. When Core CPI rises above 2% it usually results in higher interest rates and vice versa when it falls below 2%. Since higher interest rates are positive for a currency, higher inflation usually results in a stronger currency. The opposite is true when inflation falls.

Although it may seem counter-intuitive, high inflation in a country pushes up the value of its currency and vice versa for lower inflation. This is because the central bank will normally raise interest rates to combat the higher inflation, which attract more global capital inflows from investors looking for a lucrative place to park their money.

Formerly, Gold was the asset investors turned to in times of high inflation because it preserved its value, and whilst investors will often still buy Gold for its safe-haven properties in times of extreme market turmoil, this is not the case most of the time. This is because when inflation is high, central banks will put up interest rates to combat it. Higher interest rates are negative for Gold because they increase the opportunity-cost of holding Gold vis-a-vis an interest-bearing asset or placing the money in a cash deposit account. On the flipside, lower inflation tends to be positive for Gold as it brings interest rates down, making the bright metal a more viable investment alternative.


Haftungsausschluss: Nur zu Informationszwecken. Die bisherige Performance ist kein verlässlicher Indikator für zukünftige Ergebnisse.
placeholder
XRP wackelt erneut: Drei Signale, die den nächsten Rücksetzer auslösen könntenXRP stabilisiert sich am Montag nahe 1,90 US-Dollar nach dem Dip auf 1,81, doch sinkende XRPL-Aktivität (45.000), ein Einbruch profitabler Bestände (50,4%) und fallendes Open Interest (3,26 Mrd. USD) halten das Risiko einer Korrektur bis 1,61 US-Dollar hoch, während Widerstände bei 2,03/2,16/2,29 US-Dollar liegen.
Autor  Mitrade Team
Di. 27.Jan
XRP stabilisiert sich am Montag nahe 1,90 US-Dollar nach dem Dip auf 1,81, doch sinkende XRPL-Aktivität (45.000), ein Einbruch profitabler Bestände (50,4%) und fallendes Open Interest (3,26 Mrd. USD) halten das Risiko einer Korrektur bis 1,61 US-Dollar hoch, während Widerstände bei 2,03/2,16/2,29 US-Dollar liegen.
placeholder
Krypto-Ausblick: Bitcoin stabilisiert sich über 87.787 US-Dollar – Ether vor der nächsten Hürde, XRP bleibt fragil• Bitcoin pendelt am Mittwoch um 89.000 US-Dollar und hat sich nach der Vorwochenkorrektur bislang um knapp 3% erholt – entscheidend bleibt die Zone um 87.787 US-Dollar. • Ethereum arbeitet sich an die Widerstandszone heran: Erst ein Tagesschluss über 3.017 US-Dollar und der 50-Tage-EMA bei 3.101 US-Dollar würde den Weg nach oben freimachen. • XRP prallt von 1,83 US-Dollar ab und steht wieder bei 1,90 US-Dollar – doch RSI und MACD sprechen weiter für Vorsicht. Nach der kräftigen Korrektur der vergangenen Woche setzt sich im Kryptomarkt eine vorsichtige Stabilisierung durch. Bitcoin, Ether und XRP bauen ihre Erholung aus, stoßen nun aber auf charttechnisch wichtige Marken, an denen sich entscheidet, ob aus der Gegenbewegung mehr wird – oder ob der nächste Rücksetzer folgt. Bitcoin: 87.787 US-Dollar bleibt der Dreh- und Angelpunkt Bitcoin hat am Montag nach der 7,48%-Korrektur der Vorwoche wieder oberhalb der Mittellinie eines horizontalen Parallelkanals bei 87.787 US-Dollar geschlossen. Am Dienstag verteidigte der Kurs diese Zone erneut, am Mittwoch notiert BTC bei rund 89.300 US-Dollar. Hält 87.787 US-Dollar als Support, rückt die obere Begrenzung des Musters bei 90.000 US-Dollar in den Fokus. Der RSI (Tag) liegt bei 45 und steigt in Richtung der neutralen 50 – ein Hinweis auf nachlassenden Verkaufsdruck. Auch der MACD entspannt sich: Die Linien nähern sich an, die roten Histogrammbalken unterhalb der Nulllinie werden schwächer. Bricht Bitcoin dagegen per Tagesschluss wieder unter 87.787 US-Dollar, bleibt die Unterseite anfällig – dann würde die nächste Auffangzone bei 85.569 US-Dollar (zugleich 78,6% Fibonacci-Retracement) wieder relevant. Ethereum: Erst über 3.017 und 3.101 US-Dollar wird es konstruktiver Ethereum startete positiv in die Woche und legte bis Dienstag um 7,62% zu – nach der 14,22%-Korrektur in der Woche davor. Am Mittwoch nähert sich ETH dem zentralen Widerstand bei 3.017 US-Dollar. Für ein klareres Erholungssignal braucht es mehr als nur Intraday-Stärke: Ein Ausbruch über 3.017 US-Dollar und ein Tagesschluss über dem 50-Tage-EMA bei 3.101 US-Dollar könnten den Blick in Richtung des Hochs vom 14. Januar bei 3.402 US-Dollar lenken. Die Momentum-Indikatoren (RSI und MACD) deuten zwar auf nachlassenden Abwärtsdruck hin, aber das Setup bleibt empfindlich. Kommt es stattdessen zu einer erneuten Abweisung an der Widerstandszone, rückt auf der Unterseite das 61,8% Fibonacci-Retracement bei 2.749 US-Dollar wieder ins Blickfeld. XRP: Rebound ja – Trendwende noch nicht XRP hat am Sonntag die tägliche Unterstützung bei 1,83 US-Dollar getestet und anschließend binnen zwei Tagen um 4,51% zugelegt. Am Mittwoch handelt der Kurs bei 1,90 US-Dollar. Solange 1,83 US-Dollar hält, kann sich die Erholung in Richtung des nächsten Widerstands bei 1,96 US-Dollar fortsetzen. Allerdings ist der Unterton noch nicht gedreht: Der RSI liegt bei 42 und damit weiter unter der neutralen 50. Zudem bleibt das Bild im MACD belastet – das bärische Crossover der Vorwoche ist weiterhin aktiv, was das Rückschlagrisiko erhöht. Fällt XRP per Tagesschluss erneut unter 1,83 US-Dollar, wäre ein weiterer Abwärtsimpuls bis zum Tief vom 19. Dezember bei 1,77 US-Dollar wieder ein realistisches Szenario.
Autor  Mitrade Team
Mi. 28.Jan
• Bitcoin pendelt am Mittwoch um 89.000 US-Dollar und hat sich nach der Vorwochenkorrektur bislang um knapp 3% erholt – entscheidend bleibt die Zone um 87.787 US-Dollar. • Ethereum arbeitet sich an die Widerstandszone heran: Erst ein Tagesschluss über 3.017 US-Dollar und der 50-Tage-EMA bei 3.101 US-Dollar würde den Weg nach oben freimachen. • XRP prallt von 1,83 US-Dollar ab und steht wieder bei 1,90 US-Dollar – doch RSI und MACD sprechen weiter für Vorsicht. Nach der kräftigen Korrektur der vergangenen Woche setzt sich im Kryptomarkt eine vorsichtige Stabilisierung durch. Bitcoin, Ether und XRP bauen ihre Erholung aus, stoßen nun aber auf charttechnisch wichtige Marken, an denen sich entscheidet, ob aus der Gegenbewegung mehr wird – oder ob der nächste Rücksetzer folgt. Bitcoin: 87.787 US-Dollar bleibt der Dreh- und Angelpunkt Bitcoin hat am Montag nach der 7,48%-Korrektur der Vorwoche wieder oberhalb der Mittellinie eines horizontalen Parallelkanals bei 87.787 US-Dollar geschlossen. Am Dienstag verteidigte der Kurs diese Zone erneut, am Mittwoch notiert BTC bei rund 89.300 US-Dollar. Hält 87.787 US-Dollar als Support, rückt die obere Begrenzung des Musters bei 90.000 US-Dollar in den Fokus. Der RSI (Tag) liegt bei 45 und steigt in Richtung der neutralen 50 – ein Hinweis auf nachlassenden Verkaufsdruck. Auch der MACD entspannt sich: Die Linien nähern sich an, die roten Histogrammbalken unterhalb der Nulllinie werden schwächer. Bricht Bitcoin dagegen per Tagesschluss wieder unter 87.787 US-Dollar, bleibt die Unterseite anfällig – dann würde die nächste Auffangzone bei 85.569 US-Dollar (zugleich 78,6% Fibonacci-Retracement) wieder relevant. Ethereum: Erst über 3.017 und 3.101 US-Dollar wird es konstruktiver Ethereum startete positiv in die Woche und legte bis Dienstag um 7,62% zu – nach der 14,22%-Korrektur in der Woche davor. Am Mittwoch nähert sich ETH dem zentralen Widerstand bei 3.017 US-Dollar. Für ein klareres Erholungssignal braucht es mehr als nur Intraday-Stärke: Ein Ausbruch über 3.017 US-Dollar und ein Tagesschluss über dem 50-Tage-EMA bei 3.101 US-Dollar könnten den Blick in Richtung des Hochs vom 14. Januar bei 3.402 US-Dollar lenken. Die Momentum-Indikatoren (RSI und MACD) deuten zwar auf nachlassenden Abwärtsdruck hin, aber das Setup bleibt empfindlich. Kommt es stattdessen zu einer erneuten Abweisung an der Widerstandszone, rückt auf der Unterseite das 61,8% Fibonacci-Retracement bei 2.749 US-Dollar wieder ins Blickfeld. XRP: Rebound ja – Trendwende noch nicht XRP hat am Sonntag die tägliche Unterstützung bei 1,83 US-Dollar getestet und anschließend binnen zwei Tagen um 4,51% zugelegt. Am Mittwoch handelt der Kurs bei 1,90 US-Dollar. Solange 1,83 US-Dollar hält, kann sich die Erholung in Richtung des nächsten Widerstands bei 1,96 US-Dollar fortsetzen. Allerdings ist der Unterton noch nicht gedreht: Der RSI liegt bei 42 und damit weiter unter der neutralen 50. Zudem bleibt das Bild im MACD belastet – das bärische Crossover der Vorwoche ist weiterhin aktiv, was das Rückschlagrisiko erhöht. Fällt XRP per Tagesschluss erneut unter 1,83 US-Dollar, wäre ein weiterer Abwärtsimpuls bis zum Tief vom 19. Dezember bei 1,77 US-Dollar wieder ein realistisches Szenario.
placeholder
Krypto-Gewinner trotz Marktpause: Worldcoin rutscht ab, Canton vor Ausbruch – Jupiter stößt am 50-Tage-EMA anWorldcoin (WLD) korrigiert nach der 25%-Rally am 100-Tage-EMA, Canton (CC) steht vor dem Breakout über $0.1624 und Jupiter (JUP) stößt nach 16% in drei Tagen am 50-Tage-EMA bei $0.2174 an.
Autor  Mitrade Team
Gestern 03: 47
Worldcoin (WLD) korrigiert nach der 25%-Rally am 100-Tage-EMA, Canton (CC) steht vor dem Breakout über $0.1624 und Jupiter (JUP) stößt nach 16% in drei Tagen am 50-Tage-EMA bei $0.2174 an.
placeholder
Solana unter Druck: SOL rutscht weiter ab und steuert auf Schlüsselstütze bei $116 zuSolana (SOL) fällt am Donnerstag rund 2% und nähert sich der Schlüsselstütze bei $116; sinkendes Open Interest ($7,42 Mrd.), negative Funding Rate (-0,0042%) und Long-Liquidationen erhöhen das Risiko eines Rutsches Richtung $100 und $95.
Autor  Mitrade Team
Gestern 06: 10
Solana (SOL) fällt am Donnerstag rund 2% und nähert sich der Schlüsselstütze bei $116; sinkendes Open Interest ($7,42 Mrd.), negative Funding Rate (-0,0042%) und Long-Liquidationen erhöhen das Risiko eines Rutsches Richtung $100 und $95.
placeholder
Cardano rutscht unter $0,36: Geopolitische Spannungen belasten RisikoassetsCardano (ADA) fällt am Donnerstag unter $0,36 und handelt bei $0,35; US-Iran-Spannungen und ein Long-to-Short-Ratio von 0,71 erhöhen das Risiko eines Tests von $0,32 (31. Dezember) und darunter $0,27 (10. Oktober).
Autor  Mitrade Team
Gestern 06: 21
Cardano (ADA) fällt am Donnerstag unter $0,36 und handelt bei $0,35; US-Iran-Spannungen und ein Long-to-Short-Ratio von 0,71 erhöhen das Risiko eines Tests von $0,32 (31. Dezember) und darunter $0,27 (10. Oktober).
verbundene Finanzinstrumente
goTop
quote