

Crude Oil prices remain buoyed by geopolitical concerns while European economy enters doom scenario
- Crude Oil remains trading at elevated levels on Monday after severe bombings in Lebanon during the weekend.
- European PMI data shows a substantial decline in Services and Manufacturing activity in the region.
- The US Dollar Index strengthens on Monday, with European investors heading into the safe haven Greenback.
Crude Oil starts the week at elevated levels and holds above $70 on Monday after Israel intensified its bombing of Lebanon’s key positions during the weekend. The heightened geopolitical concerns are expected to remain elevated on Monday. Meanwhile, European preliminary Purchase Managers Index (PMI) data for September reveal a severe nosedive in activity in both the Manufacturing and Services sectors, which could mean even less Oil demand is expected on the horizon for the region.
The US Dollar Index (DXY), which tracks the performance of the Greenback against six other currencies, is being bought on Monday. Investors are fleeing away from the Euro and heading into safe havens such as the Greenback after the preliminary PMI data for September showed nearly all PMI indicators in Europe in contraction. The Euro might be poised for more downturn later this Monday, should the US PMIs outperform market expectations.
At the time of writing, Crude Oil (WTI) trades at $70.89 and Brent Crude at $73.83.
Oil news and market movers: Quite dispersed
- More and heavier attacks to come, Israeli army spokesperson Avichay Adraee said on Monday, Reuters reports.
- The above comments come after heavy fighting that took place on Sunday between Hezbollah and Israel, with the Lebanese militant group launching missiles deep into northern Israeli territory following intense bombardment — some of the most severe in nearly a year of conflict, according to CNN.
- The amount of Crude Oil held worldwide on tankers that have been stationary for at least seven days fell to 56.31m bbl as of September 20, a drop of 12%, Bloomberg reports.
Oil Technical Analysis: Fragile equilibrium
Crude Oil is facing some push backs from the bad European economic data released on Monday to be able to break higher. In case the US data comes in softer-than-expected later in the day, a further decline in global demand could be at hand, offsetting the priced-in risk premium on the geopolitical tensions in the Middle East. A thin equilibrium, which could snap at any moment and on the back of any headline.
The first level to watch on the upside is $71.46 (the February 5 low), which returns to the table as the next level to look out for. Ultimately, a return to $75.27 (the January 12 high) is still possible, but would likely come if a seismic shift in current balances occurs.
On the downside, the initial support remains at $67.11, a triple bottom in the summer of 2023. Further down, the next level in line is $64.38, the low from March and May 2023. Should that level face a second test and snap, $61.65 becomes a target, with $60.00 as a psychologically big figure just below it, at least tempting to be tested.
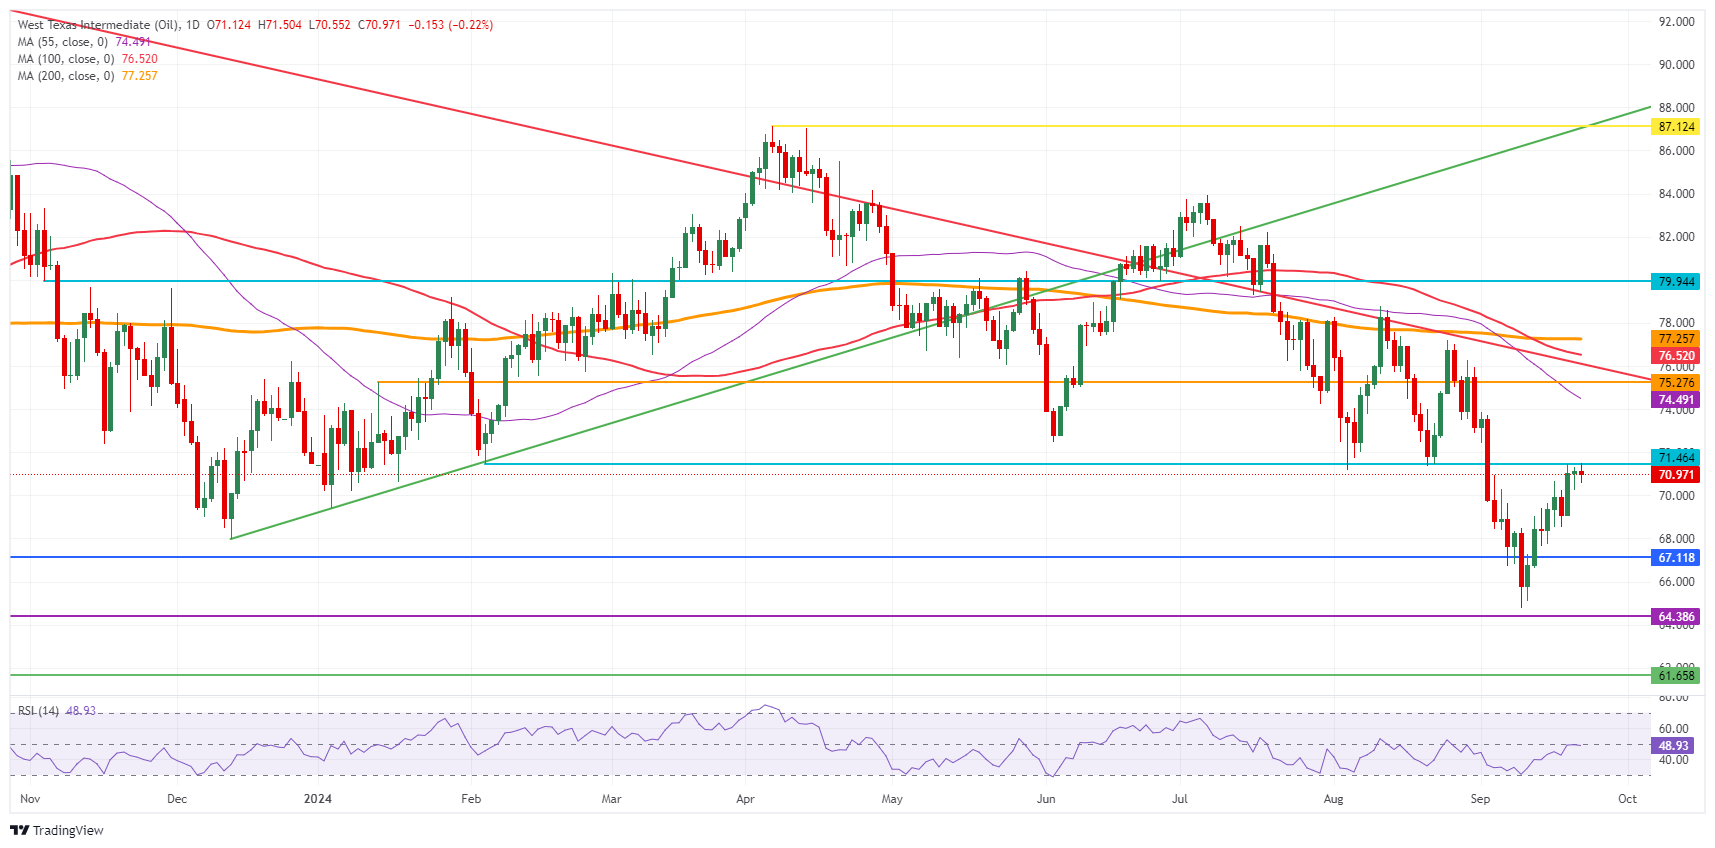
US WTI Crude Oil: Daily Chart
WTI Oil FAQs
WTI Oil is a type of Crude Oil sold on international markets. The WTI stands for West Texas Intermediate, one of three major types including Brent and Dubai Crude. WTI is also referred to as “light” and “sweet” because of its relatively low gravity and sulfur content respectively. It is considered a high quality Oil that is easily refined. It is sourced in the United States and distributed via the Cushing hub, which is considered “The Pipeline Crossroads of the World”. It is a benchmark for the Oil market and WTI price is frequently quoted in the media.
Like all assets, supply and demand are the key drivers of WTI Oil price. As such, global growth can be a driver of increased demand and vice versa for weak global growth. Political instability, wars, and sanctions can disrupt supply and impact prices. The decisions of OPEC, a group of major Oil-producing countries, is another key driver of price. The value of the US Dollar influences the price of WTI Crude Oil, since Oil is predominantly traded in US Dollars, thus a weaker US Dollar can make Oil more affordable and vice versa.
The weekly Oil inventory reports published by the American Petroleum Institute (API) and the Energy Information Agency (EIA) impact the price of WTI Oil. Changes in inventories reflect fluctuating supply and demand. If the data shows a drop in inventories it can indicate increased demand, pushing up Oil price. Higher inventories can reflect increased supply, pushing down prices. API’s report is published every Tuesday and EIA’s the day after. Their results are usually similar, falling within 1% of each other 75% of the time. The EIA data is considered more reliable, since it is a government agency.
OPEC (Organization of the Petroleum Exporting Countries) is a group of 13 Oil-producing nations who collectively decide production quotas for member countries at twice-yearly meetings. Their decisions often impact WTI Oil prices. When OPEC decides to lower quotas, it can tighten supply, pushing up Oil prices. When OPEC increases production, it has the opposite effect. OPEC+ refers to an expanded group that includes ten extra non-OPEC members, the most notable of which is Russia.
Empfohlene Artikel


