NZD/USD Price Analysis: Bulls struggle to hold gains, Kiwi outlook turns negative

Quelle Fxstreet
  • Kiwi tallies a three-day losing streak, end the week on a negative note with the pair stabilizing at 0.6115.
  • NZD/USD outlook continues to skew bearish as bulls fail to maintain upward traction.
  • Bucking the bearish trend, a break above 0.6150, the position of the 20-day SMA, is vital.

On Friday, the NZD/USD extended its losing streak to three days. Despite an attempt to rally which took the pair to a high of 0.6140, the bulls were unable to return to the positive side and the pair stabilized at 0.6115 The unsuccessful attempt to maintain gains solidifies the increasing bearish sentiment for the Kiwi. The currency pair must climb past the 20-day Simple Moving Average (SMA) situated at 0.6150 to brighten the otherwise negative outlook.

The Relative Strength Index (RSI) for the NZD/USD pair on the daily chart locates at 49, hinting at a shift of momentum towards more bearishness. Despite this downward shift, the RSI remains near the neutral zone. Furthermore, the Moving Average Convergence Divergence (MACD) continues to increase its red bars, indicating an amplified seller presence in the market.

NZD/USD daily chart
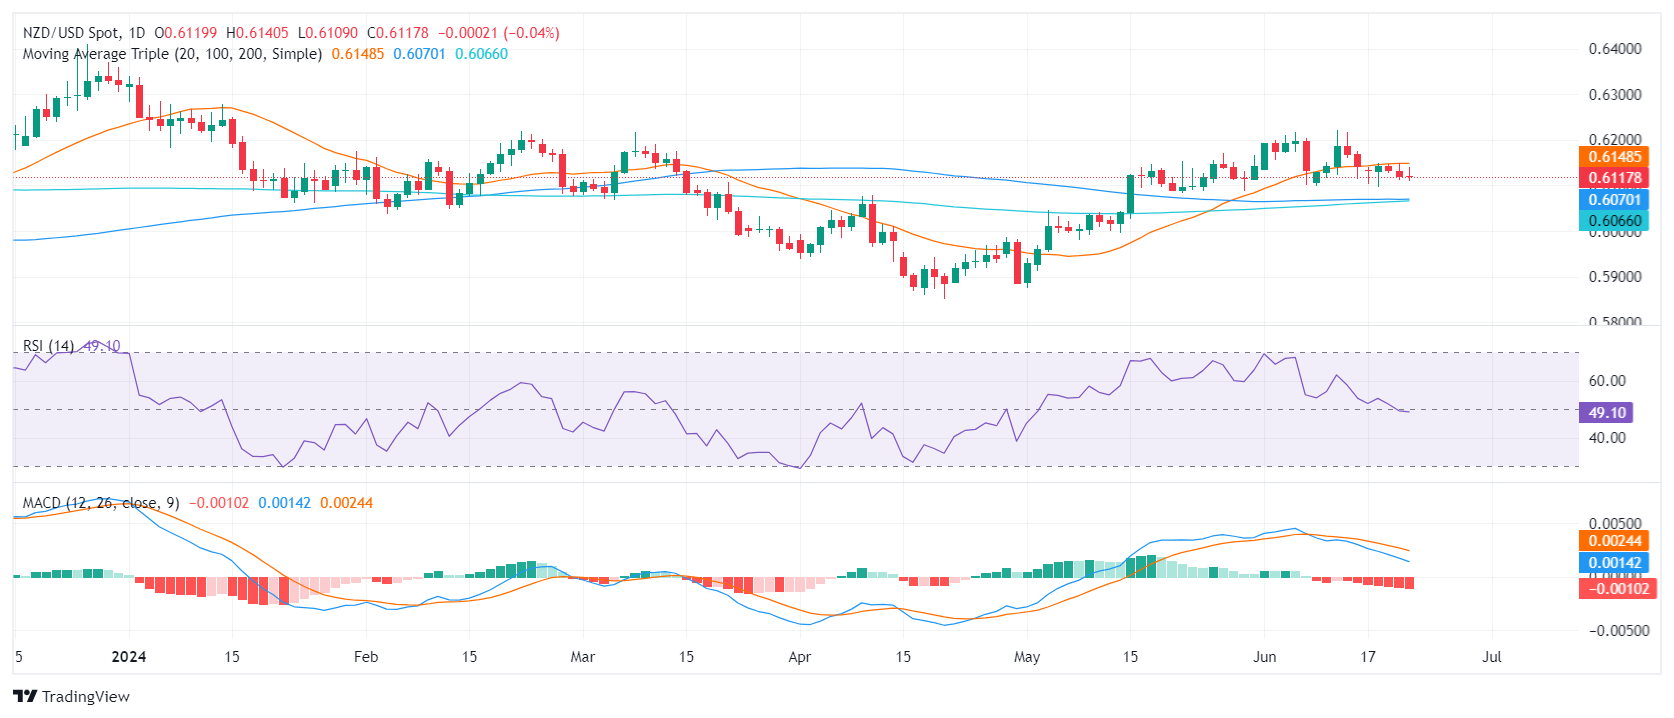
The NZD/USD finds immediate support near the 0.6100 level. Beneath that, additional support resides at the 100-day SMA at 0.6070 and the 200-day SMA at 0.6060. These levels could offer a robust defense should the pair extend its downside. A breach below these SMA convergence points might signal an intensifying sell-off scenario.

Conversely, the first resistance remains around the 20-day SMA level at 0.6150. Higher resistances are found at the 0.6170 and 0.6200 levels. A decisive breakout above these levels could possibly indicate an end to the current bearish market sentiment and start to favor the bulls.


NZD/USD

Overview
Today last price 0.6118
Today Daily Change -0.0002
Today Daily Change % -0.03
Today daily open 0.612
 
Trends
Daily SMA20 0.6148
Daily SMA50 0.6055
Daily SMA100 0.607
Daily SMA200 0.6065
 
Levels
Previous Daily High 0.6149
Previous Daily Low 0.6111
Previous Weekly High 0.6222
Previous Weekly Low 0.6099
Previous Monthly High 0.6171
Previous Monthly Low 0.5875
Daily Fibonacci 38.2% 0.6126
Daily Fibonacci 61.8% 0.6134
Daily Pivot Point S1 0.6104
Daily Pivot Point S2 0.6089
Daily Pivot Point S3 0.6066
Daily Pivot Point R1 0.6142
Daily Pivot Point R2 0.6165
Daily Pivot Point R3 0.618


Haftungsausschluss: Nur zu Informationszwecken. Die bisherige Performance ist kein verlässlicher Indikator für zukünftige Ergebnisse.
placeholder
Meme-Coins Preisprognose: Solana-basierte BONK, PENGU, WIF könnten den nächsten Markt-Bullenlauf anführenMeme-Coins wie Bonk (BONK), Pudgy Penguins (PENGU) und Dogwifhat (WIF) verzeichneten in der vergangenen Woche zweistellige Gewinne, angetrieben von einer positiven Stimmung auf dem Kryptomarkt
Autor  FXStreet
vor 10 Stunden
Meme-Coins wie Bonk (BONK), Pudgy Penguins (PENGU) und Dogwifhat (WIF) verzeichneten in der vergangenen Woche zweistellige Gewinne, angetrieben von einer positiven Stimmung auf dem Kryptomarkt
placeholder
Kryptomärkte im Minus – Anleger sichern Gewinne vor US-Inflationsdaten (CPI)Die Kryptomärkte notieren am Dienstag im roten Bereich, da Anleger vor der Veröffentlichung des US-Verbraucherpreisindex (CPI) Gewinne realisieren.
Autor  FXStreet
vor 11 Stunden
Die Kryptomärkte notieren am Dienstag im roten Bereich, da Anleger vor der Veröffentlichung des US-Verbraucherpreisindex (CPI) Gewinne realisieren.
placeholder
Silberpreis-Prognose: XAG/USD erholt sich in Richtung 38,50 US-Dollar im Vorfeld der US-InflationsdatenDer Silberpreis (XAG/USD) gleicht seine jüngsten Verluste aus der vorherigen Sitzung aus, erholt sich in Richtung eines 14-Jahres-Hochs von 39,13 USD, das am Montag erreicht wurde, und notiert während der europäischen Handelsstunden am Dienstag bei rund 38,40 USD je Feinunze.
Autor  FXStreet
vor 12 Stunden
Der Silberpreis (XAG/USD) gleicht seine jüngsten Verluste aus der vorherigen Sitzung aus, erholt sich in Richtung eines 14-Jahres-Hochs von 39,13 USD, das am Montag erreicht wurde, und notiert während der europäischen Handelsstunden am Dienstag bei rund 38,40 USD je Feinunze.
placeholder
Cardano: Nach 44 % Rallye – warum jetzt die spannendste Phase beginntCardano (ADA) lässt Anlegerherzen aktuell höher schlagen. Seit dem 1. Juli hat der Smart-Contract-Coin satte 44 % zugelegt und steht am Montag kurz vor einem neuen Tageshoch. Der Kurs notiert derzeit bei rund 0,74 US-Dollar und hält sich damit locker über der wichtigen Unterstützungsmarke bei 0,70 US-Dollar.
Autor  FXStreet
vor 13 Stunden
Cardano (ADA) lässt Anlegerherzen aktuell höher schlagen. Seit dem 1. Juli hat der Smart-Contract-Coin satte 44 % zugelegt und steht am Montag kurz vor einem neuen Tageshoch. Der Kurs notiert derzeit bei rund 0,74 US-Dollar und hält sich damit locker über der wichtigen Unterstützungsmarke bei 0,70 US-Dollar.
placeholder
Ripple im Rally-Fieber: 3 Dollar und dann das nächste Allzeithoch?Ripple (XRP) zeigt am Montag eine beeindruckende Stärke und notiert aktuell bei 2,95 US-Dollar. Während immer mehr Anleger ihre Positionen aufstocken, besonders im Derivatemarkt, steigt die Spannung: Wird XRP jetzt die psychologisch wichtige 3-Dollar-Marke knacken? Die Stimmung am Kryptomarkt könnte kaum besser sein – angeheizt von Bitcoins Rekordjagd auf über 123.000 US-Dollar.
Autor  FXStreet
vor 13 Stunden
Ripple (XRP) zeigt am Montag eine beeindruckende Stärke und notiert aktuell bei 2,95 US-Dollar. Während immer mehr Anleger ihre Positionen aufstocken, besonders im Derivatemarkt, steigt die Spannung: Wird XRP jetzt die psychologisch wichtige 3-Dollar-Marke knacken? Die Stimmung am Kryptomarkt könnte kaum besser sein – angeheizt von Bitcoins Rekordjagd auf über 123.000 US-Dollar.
verbundene Finanzinstrumente
goTop
quote