

Bitcoin bleeds under $50,000 amidst global stock market sell-off, what to expect from the BTC cycle
- Bitcoin slipped below the $50,000 support early on Monday as stock markets around the world tumbled and bonds rallied amidst recession fears.
- The crypto market noted $1.06 billion in liquidations in the past 24 hours, per Coinglass data.
- Bitcoin crashed alongside US stocks even as the 30-day Pearson correlation with the Nasdaq composite and S&P 500 is negative.
- Bitcoin could extend losses by another 12% and sweep liquidity below $47,000 before beginning a recovery.
Crypto market capitalization dipped by 15% in the past 24 hours, according to CoinGecko data, down to $1.89 trillion at the time of writing on Monday. Bitcoin suffered a steep correction alongside the S&P 500 and the Nasdaq Composite despite having a negative 30-day correlation, per IntoTheBlock data.
Bitcoin dipped under $50,000, and the biggest cryptocurrency by market capitalization is likely to extend losses further.
Data from Coinglass shows that 24-hour liquidations in crypto exceed $1 billion, one of the biggest liquidation events since the FTX exchange collapsed.
Market participants remain uncertain whether this is the end of Bitcoin’s bull run.
Crypto market capitalization, S&P 500, and Nasdaq composite
The chart below shows the drop in crypto market capitalization alongside the correction in the S&P 500 and the Nasdaq Composite. After the recent US Federal Reserve meeting, there has been a negative impact on both stocks and risk assets like Bitcoin and cryptocurrencies.
The declines in the chart below show a strong correlation between BTC and S&P 500 since July 31.
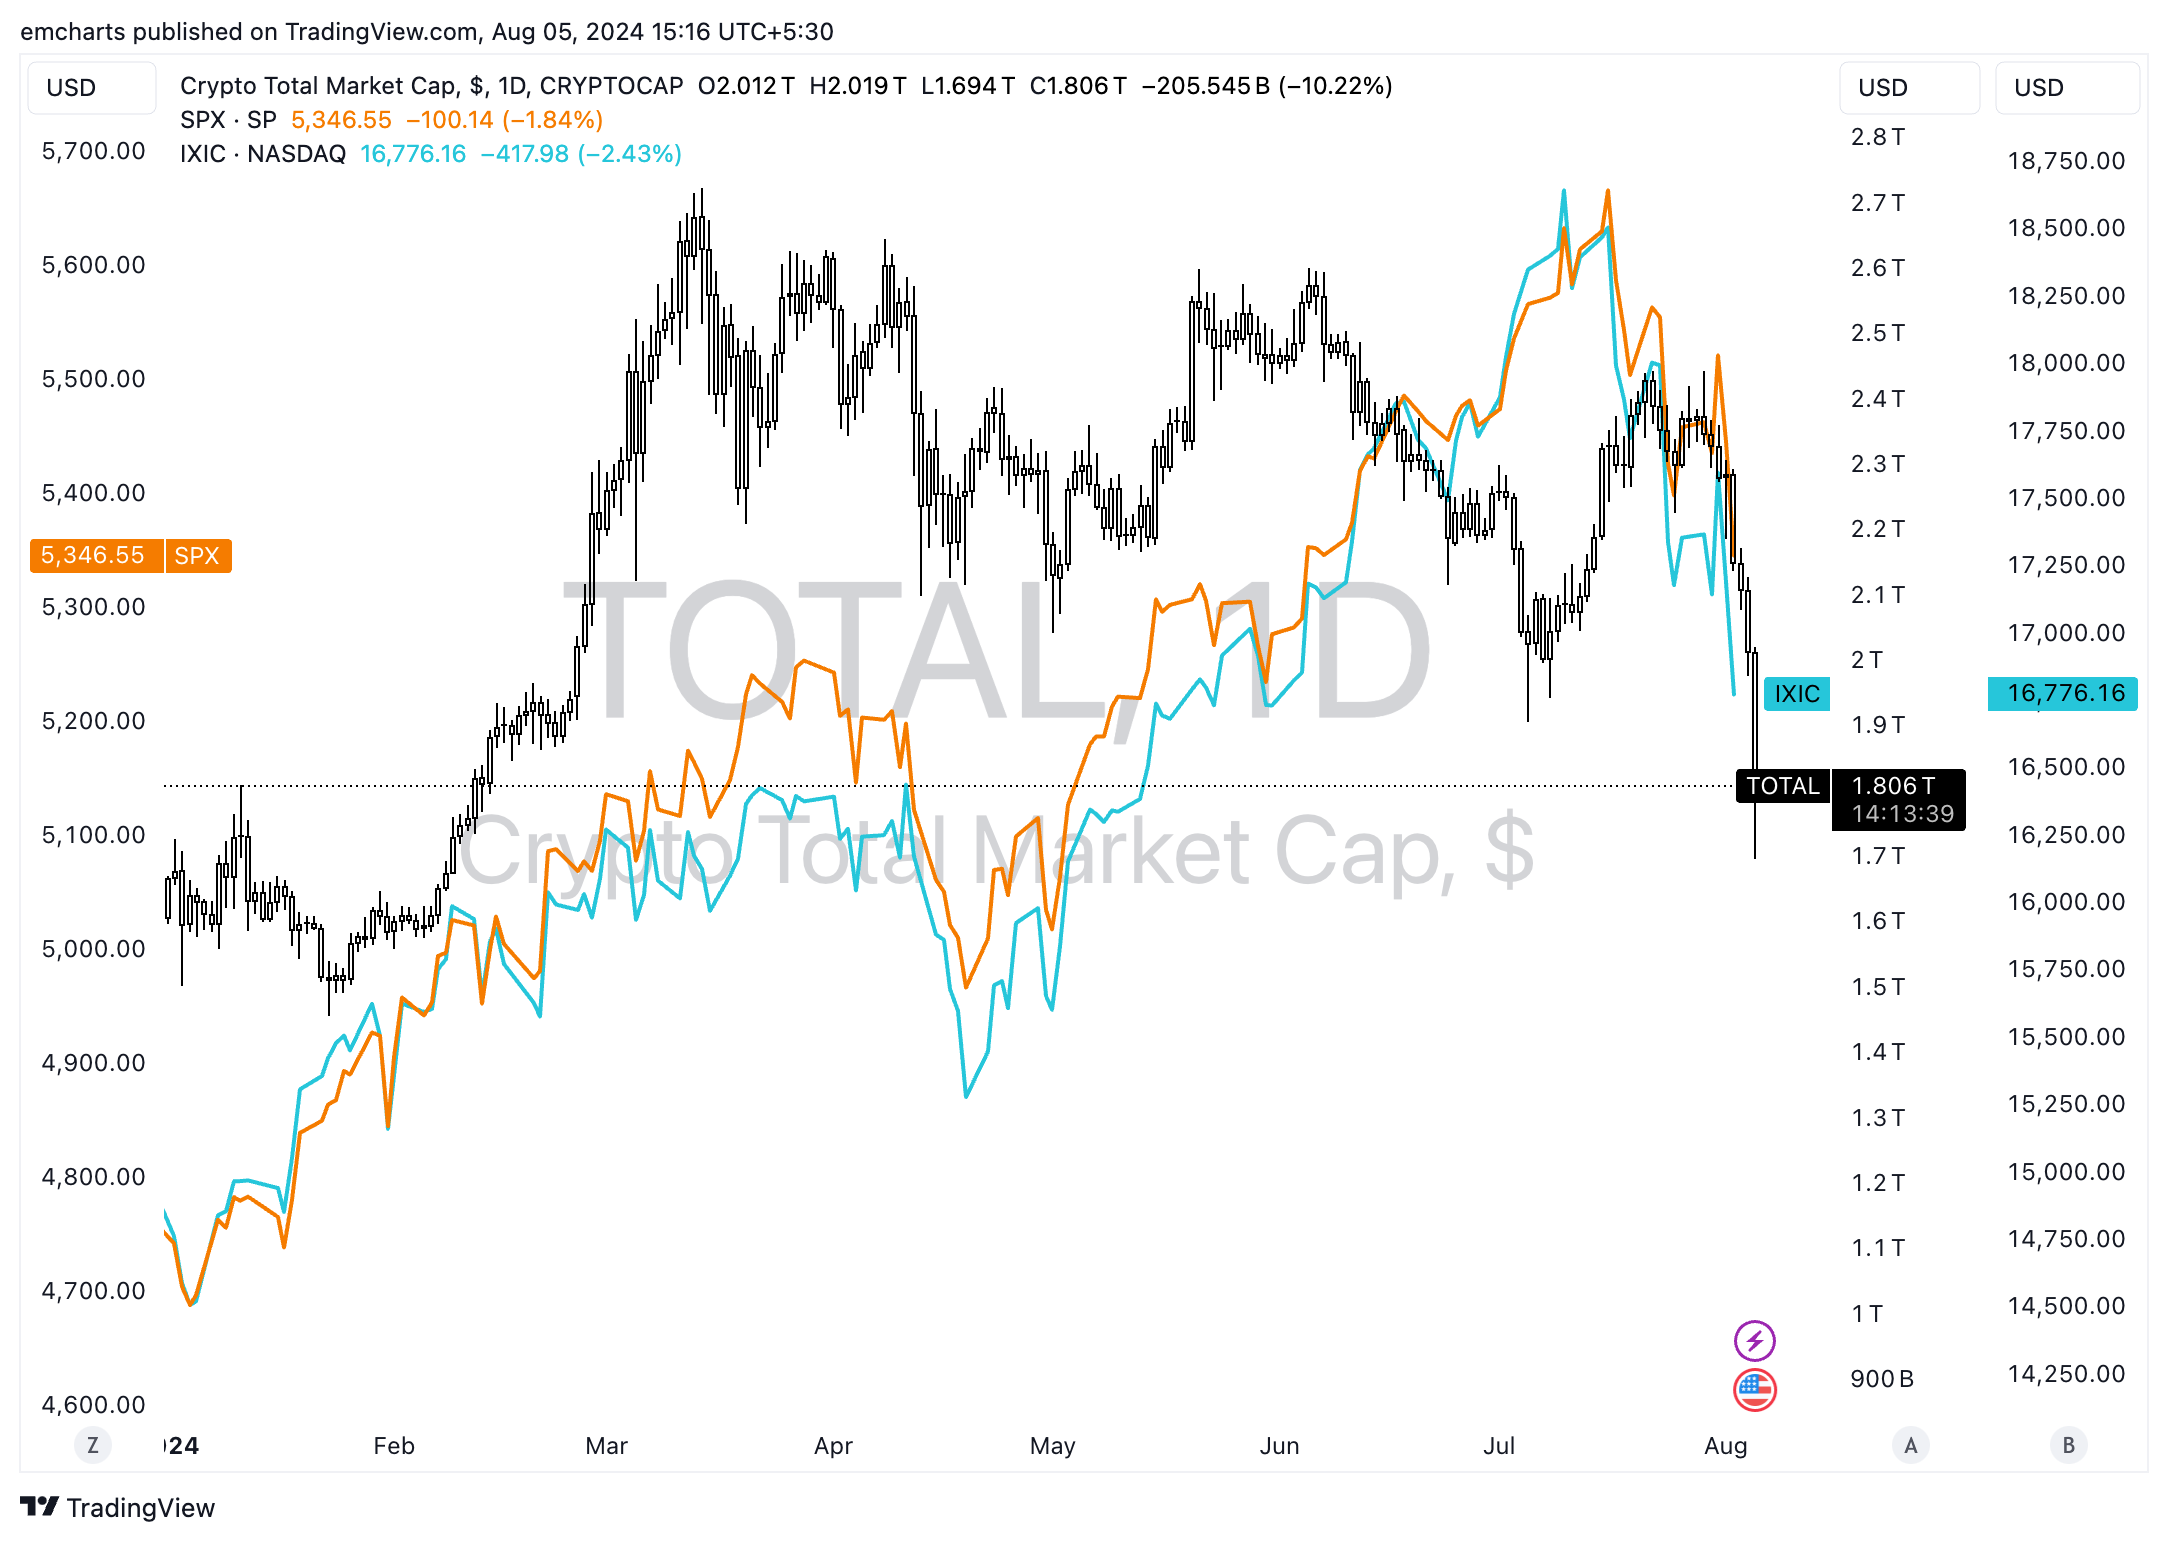
Crypto total market capitalization, SPX and IXIC
Stock markets worldwide continue to decline and bonds rally as fears of a recession increase uncertainty among crypto traders. Crypto market noted $1.06 billion in liquidation, one of the largest events since the FTX collapse.
Bitcoin could extend its losses further
Bitcoin’s price dipped under $50,000, a key psychological support level for the largest cryptocurrency by market capitalization. BTC could extend its losses by nearly 10% and sweep liquidity in the Fair Value Gap (FVG) between $45,614 and $46,800.
Bitcoin could sweep liquidity at $46,207 before beginning a recovery rally.
The Relative Strength Index (RSI) indicator reads 24.76, as BTC is currently in the “oversold” zone. When RSI is under 30, it generates a buy signal for the asset. Sidelined Bitcoin traders could consider entering the trade, based on this indicator.
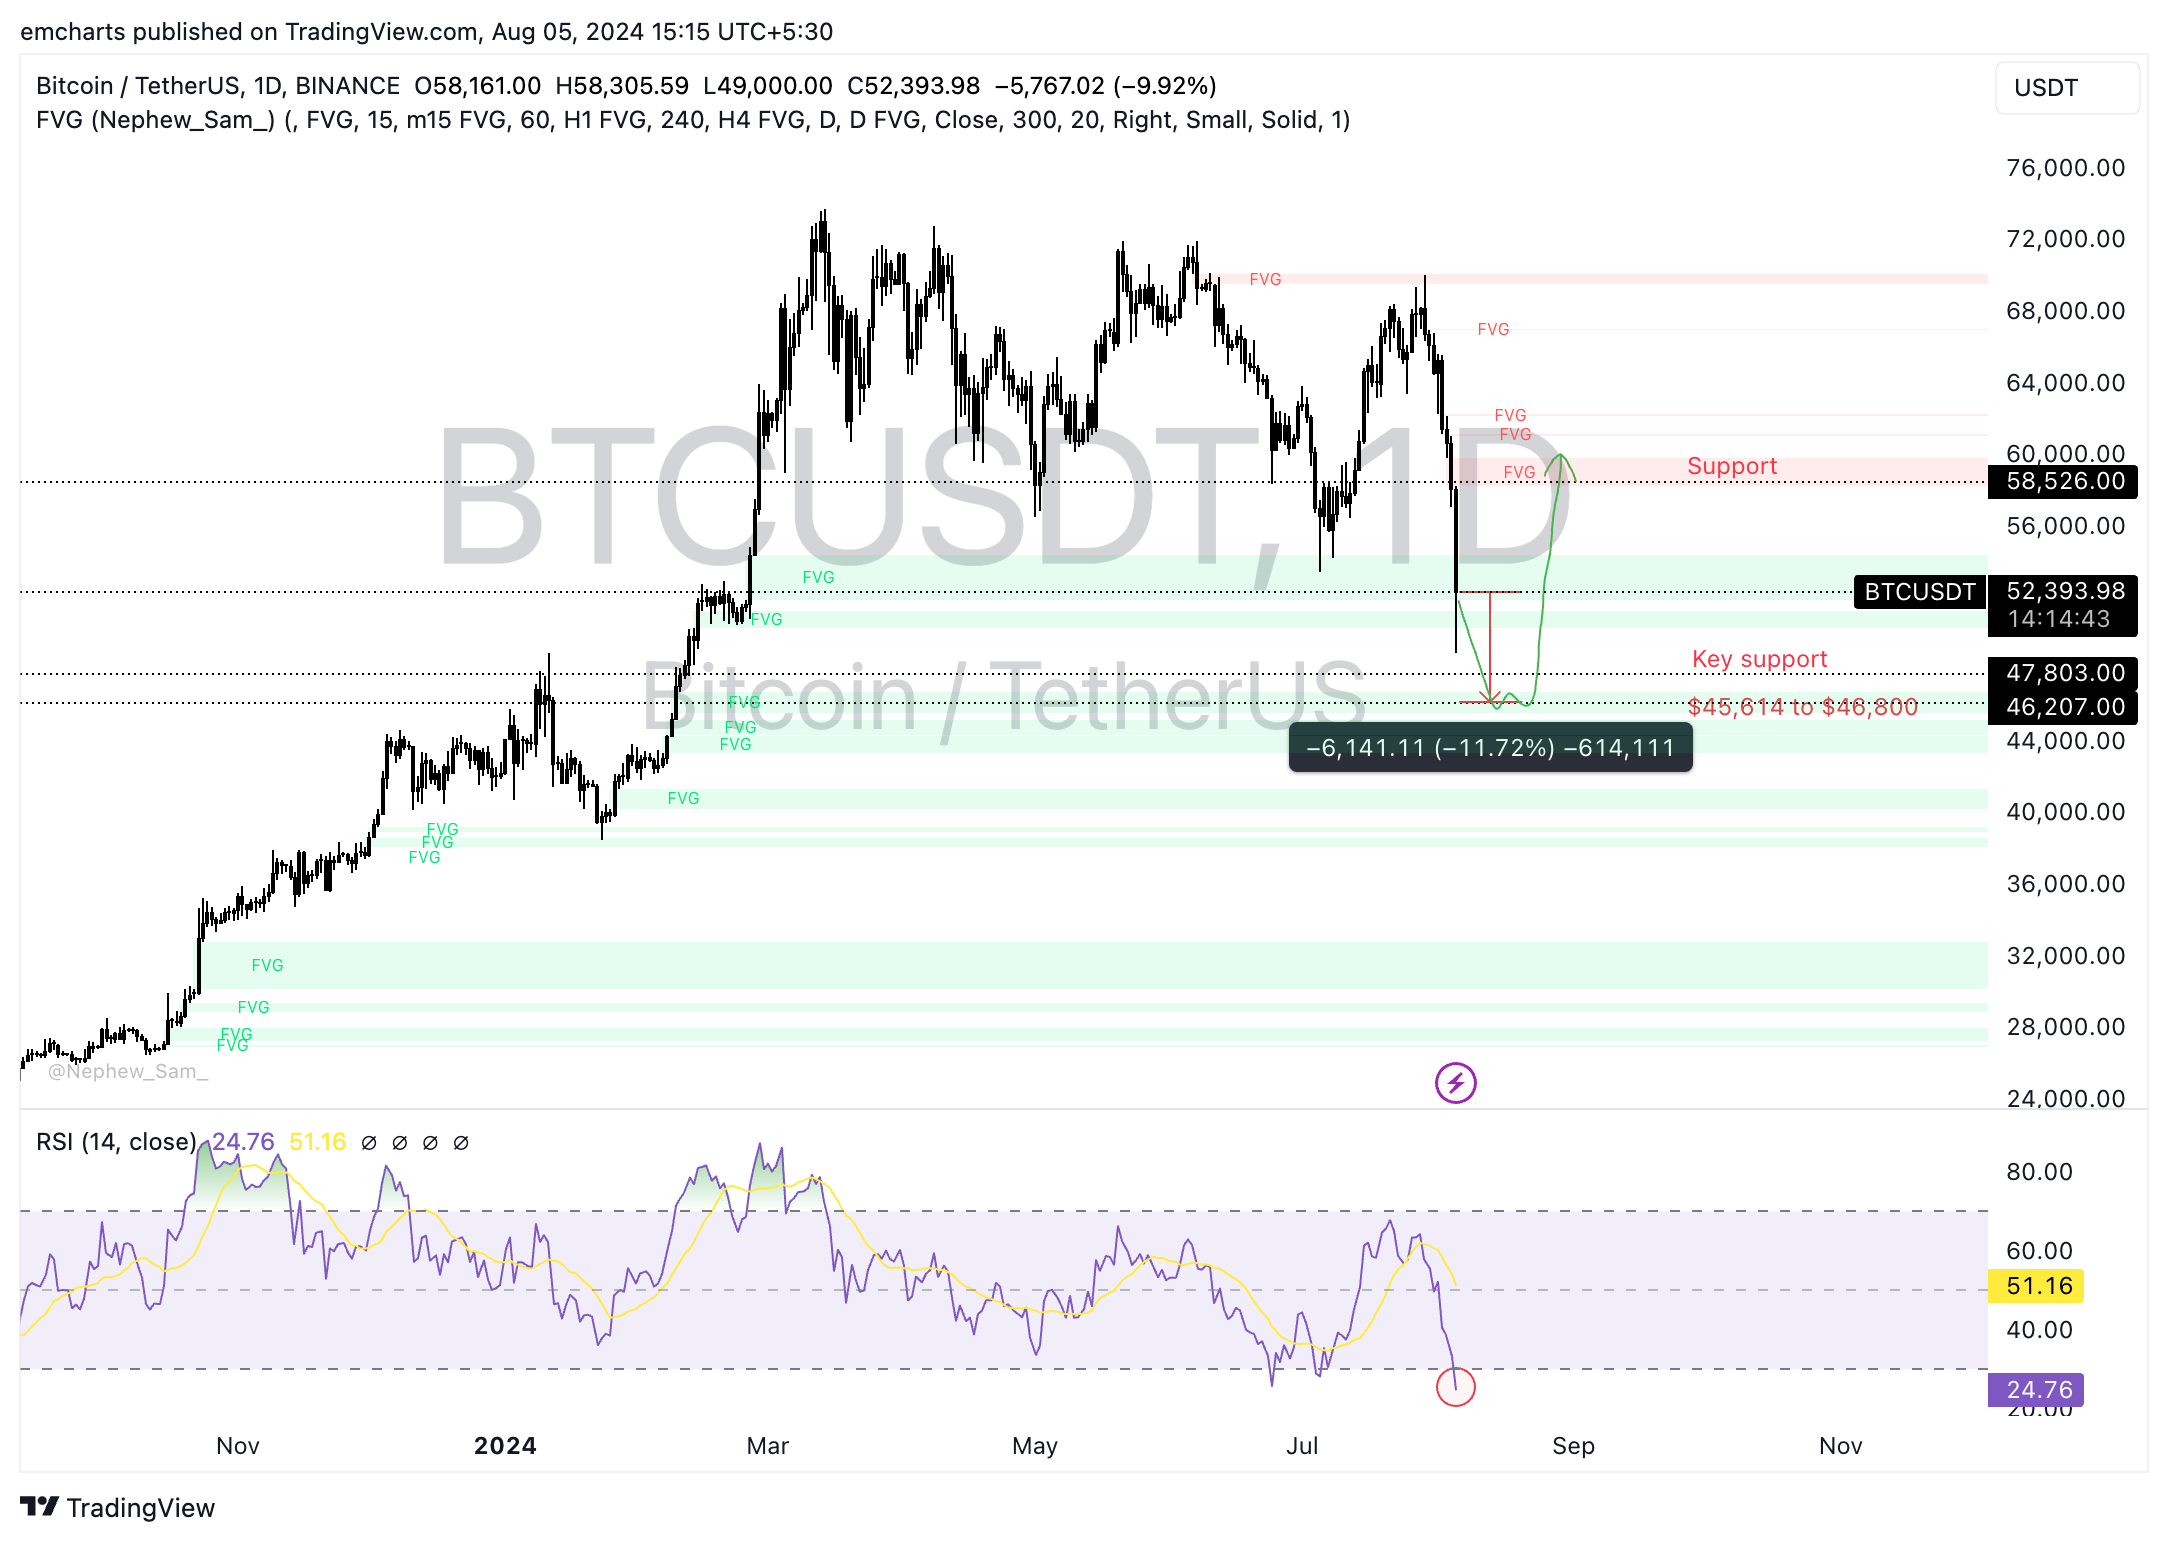
BTC/USDT daily chart
A daily candlestick close above key previous support, now resistance, at $58,526, could invalidate the bearish thesis for Bitcoin.
Bitcoin doesn’t look like “The New Gold” says analyst
Joe Weisenthal of Bloomberg says that Bitcoin’s "store of value" thesis no longer stands. The analyst was quoted in a recent tweet:
Bitcoin doesn't look like The New Gold. It looks like 3 tech stocks in a trenchcoat.
9) The Bitcoin "store of value" thesis is getting blown up right now.
— Joe Weisenthal (@TheStalwart) August 5, 2024
Bitcoin doesn't look like The New Gold. It looks like 3 tech stocks in a trenchcoat. pic.twitter.com/cY77hvXagL
Mikko Ohtamaa, co-founder of Trading Protocol, asks Weisenthal not to confuse short-term volatility with a store of value thesis.
It's difficult not to confuse short-term volatility with store of value thesis.
— Mikko Ohtamaa (@moo9000) August 5, 2024
If you cherry pick time window you can make any asset look bad.
There was a lot of leverage in Bitcoin trade and it gets unwound with everything else.
BITCOIN PLUMMETS 18% AMID JAPAN’S RATE HIKE: CRYPTO MARKET LOSES $500 BILLION
— *Walter Bloomberg (@DeItaone) August 5, 2024
Empfohlene Artikel


