

EUR/USD churns after a week of directionless weight-shifting
- EUR/USD wrapped up the trading week nearly where it started.
- Market balance has broadly recovered as wait to Fed cuts resumes.
- Coming up next week: EU GDP & US CPI inflation.
EUR/USD finished off a sedate trading week close to where it began, trading within a tight range of slightly more than 1%. Fiber tried to spark a fresh bid back above the 1.1000 handle on Monday, but price spent the rest of the week easing back into familiar technical levels.
Forecasting the Coming Week: US CPI and Fed’s easing should rule the sentiment
Market focus remains squarely on the odds of a September rate cut. Rate markets have fully priced in the start of a rate cutting cycle when the Federal Open Market Committee (FOMC) meets on September 18, but bets of an initial double cut for 50 basis points have eased to slightly-better-than-even from nearly 70% earlier this week. According to the CME’s FedWatch Tool, rate traders are pricing in 53.5% odds of a 50 bps cut in September, with an additional two cuts worth 25 basis points apiece through the remainder of 2024.
Coming up next week, investors will get a fresh batch of inflation data to worry about, with US Producer Price Index (PPI) and Consumer Price Index (CPI) inflation on the cards for Tuesday and Wednesday, respectively. US Retail Sales and another update from the University of Michigan’s Consumer Sentiment Survey Index are also due later next week. Core PPI inflation and headline CPI inflation are both still stuck around 3% YoY, and investors will be hoping for a continued easing in the prints to keep the Fed on the rails toward rate cuts.
Preliminary pan-EU Gross Domestic Product (GDP) growth figures are due next week at the Wednesday hump. Median market forecasts are expecting EU growth to hold steady at current levels, with forecasts matching the previous prints of 0.3% and 0.6% on the QoQ and YoY timeframes, respectively.
Euro PRICE This week
The table below shows the percentage change of Euro (EUR) against listed major currencies this week. Euro was the strongest against the Swiss Franc.
| USD | EUR | GBP | JPY | CAD | AUD | NZD | CHF | |
|---|---|---|---|---|---|---|---|---|
| USD | -0.03% | 0.34% | 0.01% | -1.01% | -0.96% | -0.77% | 0.82% | |
| EUR | 0.03% | 0.32% | -0.08% | -1.11% | -0.87% | -0.82% | 0.75% | |
| GBP | -0.34% | -0.32% | -0.34% | -1.37% | -1.17% | -1.12% | 0.42% | |
| JPY | -0.01% | 0.08% | 0.34% | -0.99% | -0.96% | -0.82% | 0.82% | |
| CAD | 1.01% | 1.11% | 1.37% | 0.99% | 0.10% | 0.24% | 1.68% | |
| AUD | 0.96% | 0.87% | 1.17% | 0.96% | -0.10% | 0.04% | 1.60% | |
| NZD | 0.77% | 0.82% | 1.12% | 0.82% | -0.24% | -0.04% | 1.56% | |
| CHF | -0.82% | -0.75% | -0.42% | -0.82% | -1.68% | -1.60% | -1.56% |
The heat map shows percentage changes of major currencies against each other. The base currency is picked from the left column, while the quote currency is picked from the top row. For example, if you pick the Euro from the left column and move along the horizontal line to the US Dollar, the percentage change displayed in the box will represent EUR (base)/USD (quote).
EUR/USD price forecast
Fiber continues to trade on the high side of a rough descending channel that has weighed on EUR/USD for the duration of 2024. The pair is holding just outside of recent technical ceiling barriers, but bullish momentum remains crimped below 1.1000.
A rising pattern of higher lows is solidifying on daily candlesticks, but EUR/USD is still poised for another dip back into the 200-day Exponential Moving Average (EMA) near 1.0800 if bidders don’t return to the fold and get EUR/USD bolstered into fresh near-term highs.
EUR/USD daily chart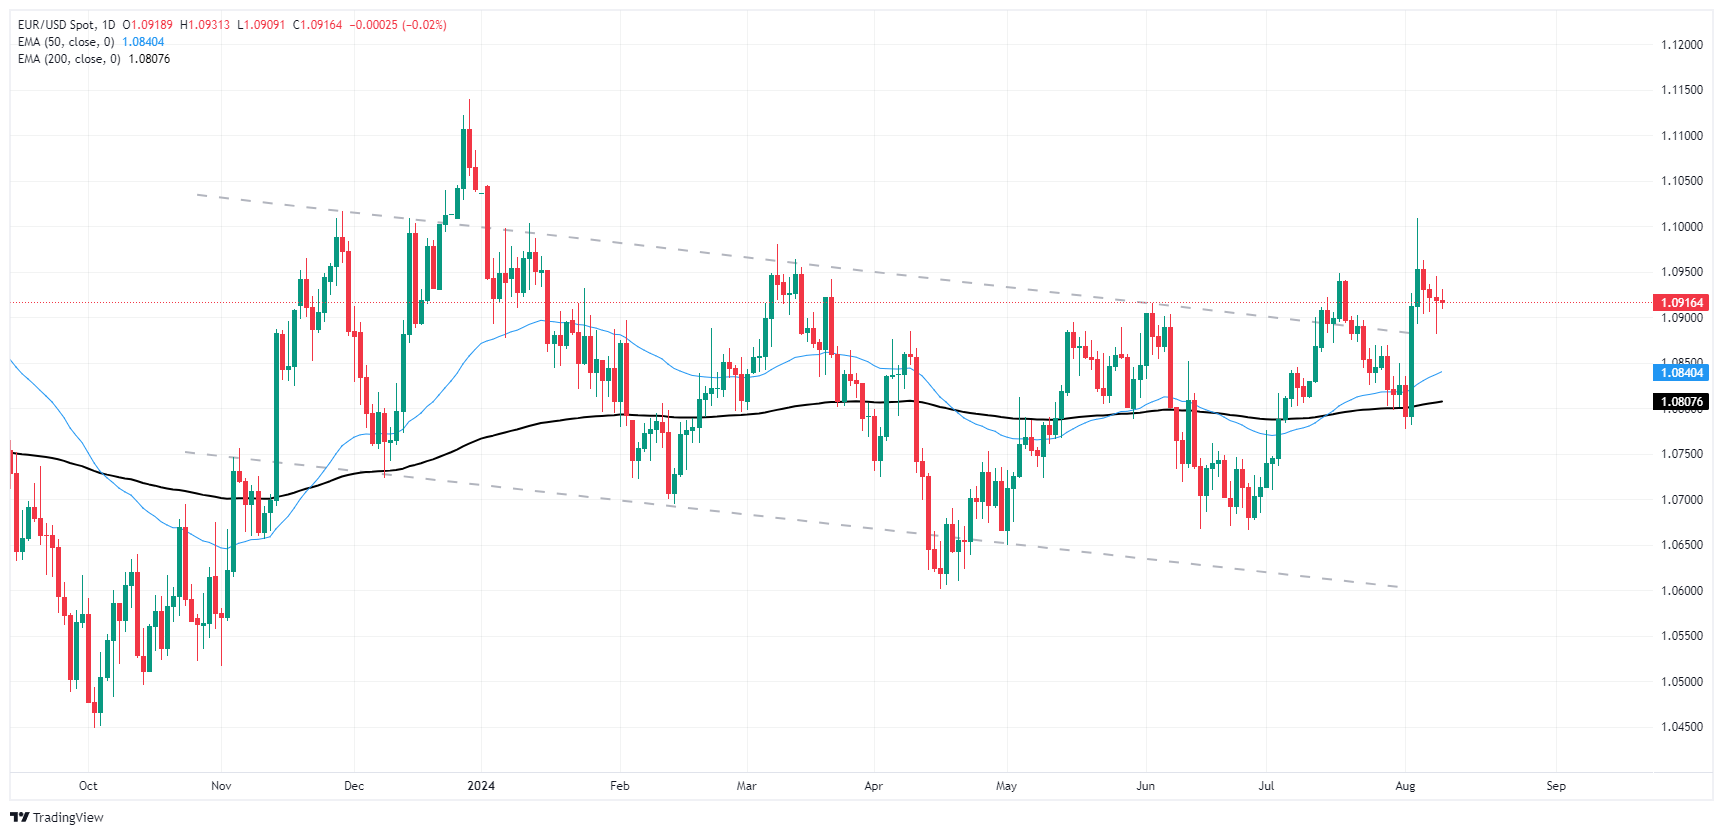
Euro FAQs
The Euro is the currency for the 20 European Union countries that belong to the Eurozone. It is the second most heavily traded currency in the world behind the US Dollar. In 2022, it accounted for 31% of all foreign exchange transactions, with an average daily turnover of over $2.2 trillion a day. EUR/USD is the most heavily traded currency pair in the world, accounting for an estimated 30% off all transactions, followed by EUR/JPY (4%), EUR/GBP (3%) and EUR/AUD (2%).
The European Central Bank (ECB) in Frankfurt, Germany, is the reserve bank for the Eurozone. The ECB sets interest rates and manages monetary policy. The ECB’s primary mandate is to maintain price stability, which means either controlling inflation or stimulating growth. Its primary tool is the raising or lowering of interest rates. Relatively high interest rates – or the expectation of higher rates – will usually benefit the Euro and vice versa. The ECB Governing Council makes monetary policy decisions at meetings held eight times a year. Decisions are made by heads of the Eurozone national banks and six permanent members, including the President of the ECB, Christine Lagarde.
Eurozone inflation data, measured by the Harmonized Index of Consumer Prices (HICP), is an important econometric for the Euro. If inflation rises more than expected, especially if above the ECB’s 2% target, it obliges the ECB to raise interest rates to bring it back under control. Relatively high interest rates compared to its counterparts will usually benefit the Euro, as it makes the region more attractive as a place for global investors to park their money.
Data releases gauge the health of the economy and can impact on the Euro. Indicators such as GDP, Manufacturing and Services PMIs, employment, and consumer sentiment surveys can all influence the direction of the single currency. A strong economy is good for the Euro. Not only does it attract more foreign investment but it may encourage the ECB to put up interest rates, which will directly strengthen the Euro. Otherwise, if economic data is weak, the Euro is likely to fall. Economic data for the four largest economies in the euro area (Germany, France, Italy and Spain) are especially significant, as they account for 75% of the Eurozone’s economy.
Another significant data release for the Euro is the Trade Balance. This indicator measures the difference between what a country earns from its exports and what it spends on imports over a given period. If a country produces highly sought after exports then its currency will gain in value purely from the extra demand created from foreign buyers seeking to purchase these goods. Therefore, a positive net Trade Balance strengthens a currency and vice versa for a negative balance.
Empfohlene Artikel


