NZD/USD Price Analysis: Consolidation phase intensifies, bulls present battle

Quelle Fxstreet
  • The NZD/USD stabilizes near 20-day SMA as bears intensify their attempts to breach the20-day SMA.
  • Despite spirited defenses, both bulls and bears are yet to make significant headway.
  • Daily chart indicators underscore continued consolidation with a slight downward momentum.

The NZD/USD dipped to a low of 0.6115 before recovering and stabilizing at the 20-day Simple Moving Average (SMA) of 0.6140. Both bulls and bears seem locked in an intense tussle with attempts to breach the 0.6220 area and the 20-day SMA respectively proving unsuccessful. This is indicative of an ongoing consolidation phase in the aftermath of Mid-May's sharp increase which saw the pair rise by more than 1.30%.

In the daily chart, the Relative Strength Index (RSI) has switched momentum and is now pointing downwards, suggesting a slight decline in buying pressure. This downward shift in the RSI is consistent with the flat red bars in the Moving Average Convergence Divergence (MACD), which further corroborates the consolidation narrative.

NZD/USD daily chart
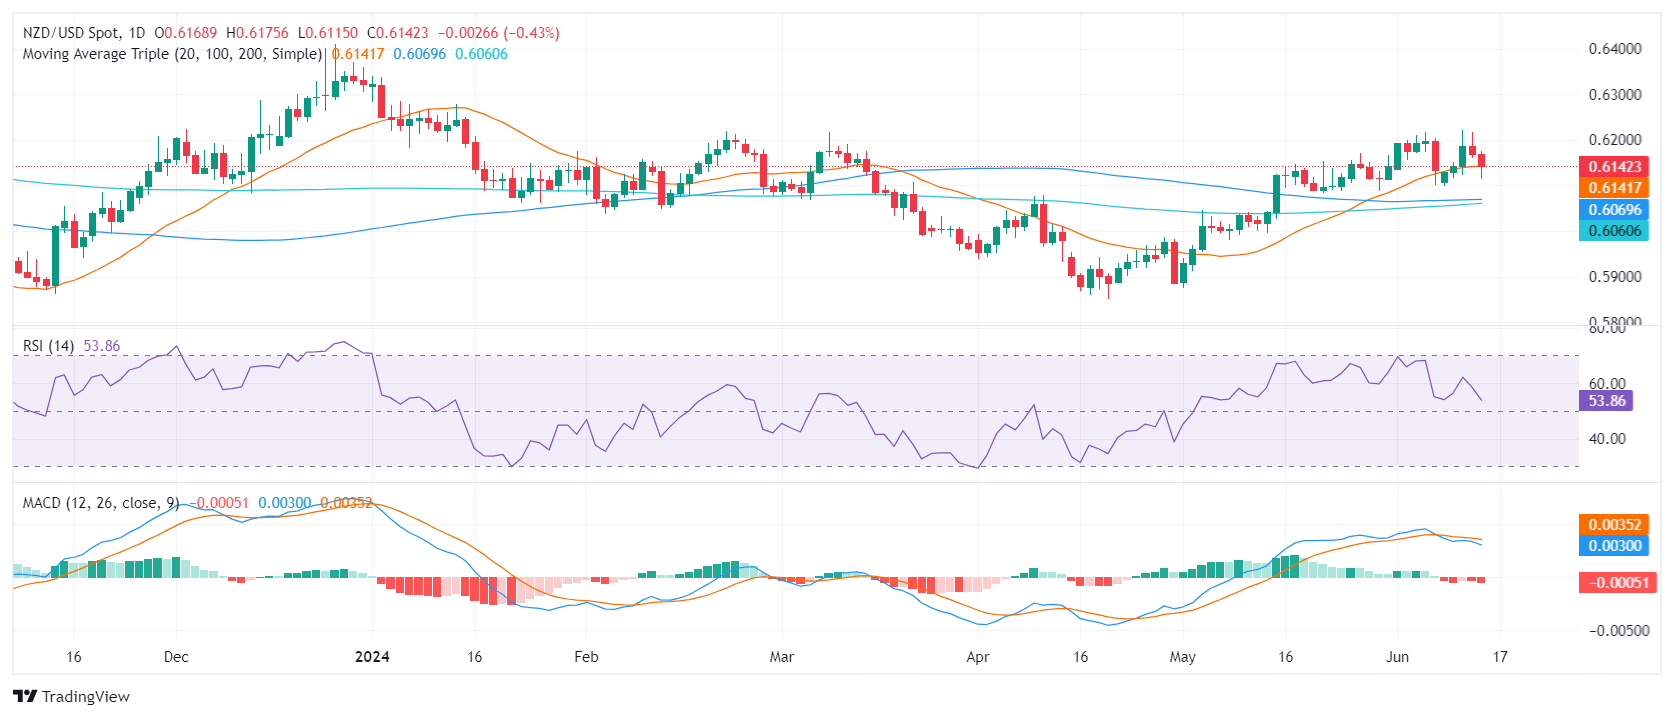
The NZD/USD's immediate support is now at the 20-day SMA of 0.6140, with the 100 and 200-day SMAs converging in the 0.6050-0.6060 region and providing a strong support base for the pair. This could potentially serve as an anchor for correction if bears begin to take control. Any movements below this point of convergence may potentially signal sell conditions.

On the upside, the 0.6200 is the main resistance which in case of being breached, could be considered a buy signal.


NZD/USD

Overview
Today last price 0.6142
Today Daily Change -0.0027
Today Daily Change % -0.44
Today daily open 0.6169
 
Trends
Daily SMA20 0.6141
Daily SMA50 0.6044
Daily SMA100 0.6069
Daily SMA200 0.6059
 
Levels
Previous Daily High 0.6218
Previous Daily Low 0.6159
Previous Weekly High 0.6216
Previous Weekly Low 0.6101
Previous Monthly High 0.6171
Previous Monthly Low 0.5875
Daily Fibonacci 38.2% 0.6181
Daily Fibonacci 61.8% 0.6195
Daily Pivot Point S1 0.6146
Daily Pivot Point S2 0.6123
Daily Pivot Point S3 0.6088
Daily Pivot Point R1 0.6205
Daily Pivot Point R2 0.624
Daily Pivot Point R3 0.6263


Haftungsausschluss: Nur zu Informationszwecken. Die bisherige Performance ist kein verlässlicher Indikator für zukünftige Ergebnisse.
placeholder
Ergebnisvorschau: Schwächelnde Tesla-Aktie – Kann das Q3-Ergebnis das Vertrauen wiederherstellen?Insights - Enttäuschung nach Tesla Robotaxi-Präsentation: Anleger hoffen auf positive Aussichten im Q3-Bericht
Autor  Mitrade Team
Gestern 09: 44
Insights - Enttäuschung nach Tesla Robotaxi-Präsentation: Anleger hoffen auf positive Aussichten im Q3-Bericht
placeholder
Goldpreis eilt weiter von Rekord zu Rekord – CommerzbankDer Goldpreis startete in die neue Handelswoche dort, wo er in der Vorwoche aufgehört hatte, mit einem Anstieg auf ein neues Rekordhoch von aktuell $2.740 je Feinunze. Der Anstieg von 2,4 Prozent in der vergangenen Woche war bereits der fünfte in den vergangenen sechs Wochen, stellt Carsten Fritsch, Rohstoffanalyst der Commerzbank, fest.
Autor  FXStreet
vor 11 Stunden
Der Goldpreis startete in die neue Handelswoche dort, wo er in der Vorwoche aufgehört hatte, mit einem Anstieg auf ein neues Rekordhoch von aktuell $2.740 je Feinunze. Der Anstieg von 2,4 Prozent in der vergangenen Woche war bereits der fünfte in den vergangenen sechs Wochen, stellt Carsten Fritsch, Rohstoffanalyst der Commerzbank, fest.
placeholder
Ripple wird Ethereum 2025 von Platz 2 der Kryptowährungen verdrängenInvesting.com – Die Kryptowelt ist in Aufruhr, und ein Name drängt sich vehement ins Rampenlicht: Ripple. Die brennende Frage, die die Community in Atem hält, lautet: Wird XRP Ethereum in 2025 wirklic
Autor  Investing.com
vor 10 Stunden
Investing.com – Die Kryptowelt ist in Aufruhr, und ein Name drängt sich vehement ins Rampenlicht: Ripple. Die brennende Frage, die die Community in Atem hält, lautet: Wird XRP Ethereum in 2025 wirklic
placeholder
USD/JPY: Kann wichtigen Widerstand bei 151,00 durchbrechen - UOBDer US-Dollar (USD) könnte den wichtigen Widerstand bei 151,00 durchbrechen, sich aber möglicherweise nicht darüber halten können. Längerfristig hat die Dynamik deutlich zugenommen, und wenn der USD über 151,00 steigt, wird sich der Fokus auf 152,00 verlagern, so die FX-Analysten der UOB Group, Quek Ser Leang und Peter Chia.
Autor  FXStreet
vor 10 Stunden
Der US-Dollar (USD) könnte den wichtigen Widerstand bei 151,00 durchbrechen, sich aber möglicherweise nicht darüber halten können. Längerfristig hat die Dynamik deutlich zugenommen, und wenn der USD über 151,00 steigt, wird sich der Fokus auf 152,00 verlagern, so die FX-Analysten der UOB Group, Quek Ser Leang und Peter Chia.
placeholder
Silberpreis auf 12-Jahres-Hoch – CommerzbankLange Zeit hinkte der Silberpreis dem Anstieg des Goldpreises hinterher, stellt Carsten Fritsch, Rohstoffanalyst der Commerzbank, fest.
Autor  FXStreet
vor 8 Stunden
Lange Zeit hinkte der Silberpreis dem Anstieg des Goldpreises hinterher, stellt Carsten Fritsch, Rohstoffanalyst der Commerzbank, fest.
verbundene Finanzinstrumente
goTop
quote