

Dow Jones climbs on Monday as risk appetite lurches higher
- Investors pile back into US equity indexes to kick off the new week.
- Market sentiment is recovering as key US data looms ahead.
- DJIA surges above 38,400.00 before returning to 38,200 heading into the closing bell.
The Dow Jones Industrial Average (DJIA) is on the run into the top side to open the new trading week, with the index climbing into a five-day peak above 38,400.00. Overextended bidding came quickly under heel, keeping the index pinned near 38,200.00, but US indexes are kicking off the new trading week firmly into the bullish side.
Broad-market investor sentiment is improving after last week’s heightened concerns over a growing altercation in the Middle East. Cooler heads have prevailed, allowing investor confidence to seep back into the boards.
Tuesday kicks off the US’ economic data docket with the S&P Global Purchasing Managers Index. The Manufacturing component is forecast to tick up slightly to 52.0 in April from March’s 51.9, while the Services component is expected to climb to 52.0 from the previous 51.7.
US Gross Domestic Product (GDP) for the annualized first quarter prints on Wednesday and is expected to ease back to 2.5% from the previous print of 3.4%, while Thursday sees a fresh round of US COre Personal Consumption Expenditures (PCE). US PCE inflation is expected to hold steady at 0.3% for the month of March, while the YoY figure is forecast to tick down slightly to 2.6% from 2.8%.
Dow Jones news
Of the thirty securities that make up the Dow Jones Industrial Average, only five were in the red on Monday, with Verizon Communications Inc. (VZ) leading the charge into bear country. VZ fell nearly 5% on the day, declining -1.89 to trade at $38.60 per share.
The Dow’s top gainer to start the week was Goldman Sachs Group Inc. (GS), which climbed 3.3% on Monday to trade into $417.35. GS was followed by JPMorgan Chase & Co. (JPM) which gained nearly 2% and ended Monday near $189.41 per share.
Dow Jones technical outlook
The Dow Jones climbed to a five-day high on Monday near 38,400.00 before settling close to 38,230.00 at the closing bell. The major equity index is still down over 4% from late March’s record peaks just shy of the 40,000.00 mega handle. Despite downside momentum, the Dow Jones continues to pump the brakes on any meaningful declines, with the index trading well above the 200-day Exponential Moving Average (EMA) at 36,683.77.
Dow Jones daily chart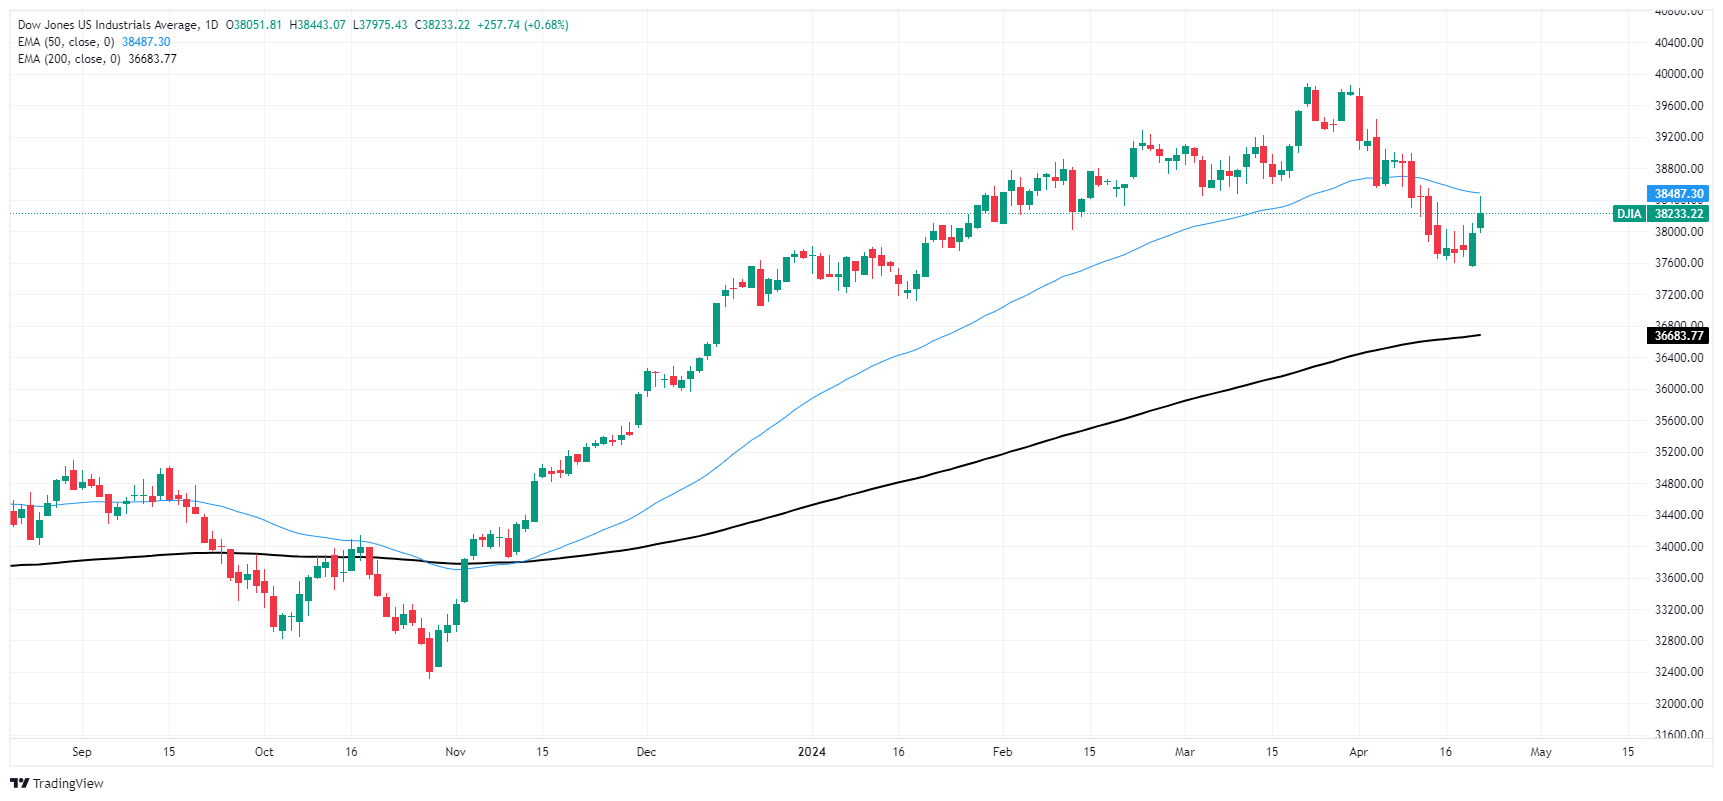
Dow Jones FAQs
The Dow Jones Industrial Average, one of the oldest stock market indices in the world, is compiled of the 30 most traded stocks in the US. The index is price-weighted rather than weighted by capitalization. It is calculated by summing the prices of the constituent stocks and dividing them by a factor, currently 0.152. The index was founded by Charles Dow, who also founded the Wall Street Journal. In later years it has been criticized for not being broadly representative enough because it only tracks 30 conglomerates, unlike broader indices such as the S&P 500.
Many different factors drive the Dow Jones Industrial Average (DJIA). The aggregate performance of the component companies revealed in quarterly company earnings reports is the main one. US and global macroeconomic data also contributes as it impacts on investor sentiment. The level of interest rates, set by the Federal Reserve (Fed), also influences the DJIA as it affects the cost of credit, on which many corporations are heavily reliant. Therefore, inflation can be a major driver as well as other metrics which impact the Fed decisions.
Dow Theory is a method for identifying the primary trend of the stock market developed by Charles Dow. A key step is to compare the direction of the Dow Jones Industrial Average (DJIA) and the Dow Jones Transportation Average (DJTA) and only follow trends where both are moving in the same direction. Volume is a confirmatory criteria. The theory uses elements of peak and trough analysis. Dow’s theory posits three trend phases: accumulation, when smart money starts buying or selling; public participation, when the wider public joins in; and distribution, when the smart money exits.
There are a number of ways to trade the DJIA. One is to use ETFs which allow investors to trade the DJIA as a single security, rather than having to buy shares in all 30 constituent companies. A leading example is the SPDR Dow Jones Industrial Average ETF (DIA). DJIA futures contracts enable traders to speculate on the future value of the index and Options provide the right, but not the obligation, to buy or sell the index at a predetermined price in the future. Mutual funds enable investors to buy a share of a diversified portfolio of DJIA stocks thus providing exposure to the overall index.
Empfohlene Artikel


