Uniswap Price Forecast: UNI could be poised for 30% rally after month-long lull

Quelle Fxstreet
  • Uniswap price breaks out of the 35-day consolidation price zone, signaling a potential upward move.
  • On-chain data shows tokens from dormant wallets are moving again.
  • A daily candlestick close below $6.76 invalidates the bullish thesis.

Uniswap (UNI) price has broken out of a 35-day consolidation this week, a sign of a possible rally ahead that could increase the token’s price around 30%. Technical indicators support the bullish thesis, while on-chain data also aligns with it.

Uniswap price looks set to reclaim highs

Uniswap price broke the $6.76 to $8.20 consolidation after a 20% rally on May 22. This move also allowed UNI to establish itself above the 200-day Exponential Moving Average (EMA), currently hovering at $8.07. Typically, massive moves tend to revert to the mean, which provides an opportunity for sidelined buyers to accumulate. 

There are three levels to buy UNI dip.

  1. A retest of the 200-day EMA at $8.07, roughly 13% lower than the current price of $9.40.
  2. The daily order block, extending from $7.53 to $7.97, coincides with the 200-day EMA and is the second level to buy UNI.
  3. Investors can also consider securing UNI if it retests the upper limit of the aforementioned range at $8.20. 

Assuming Uniswap price bounces from the $8.20 level, the conservative target is $10.61, which is roughly 30% away. Beyond this, UNI could also retest $12.80 in case of an extremely bullish outlook. This move would constitute a 60% gain. The second target is ambitious and is only likely to occur if the market condition is extremely bullish.

Supporting this bullish thesis, the Relative Strength Index (RSI) and the Awesome Oscillator (AO), both of which, have breached their mean levels of 50 and 0, indicating that the bulls are in control.
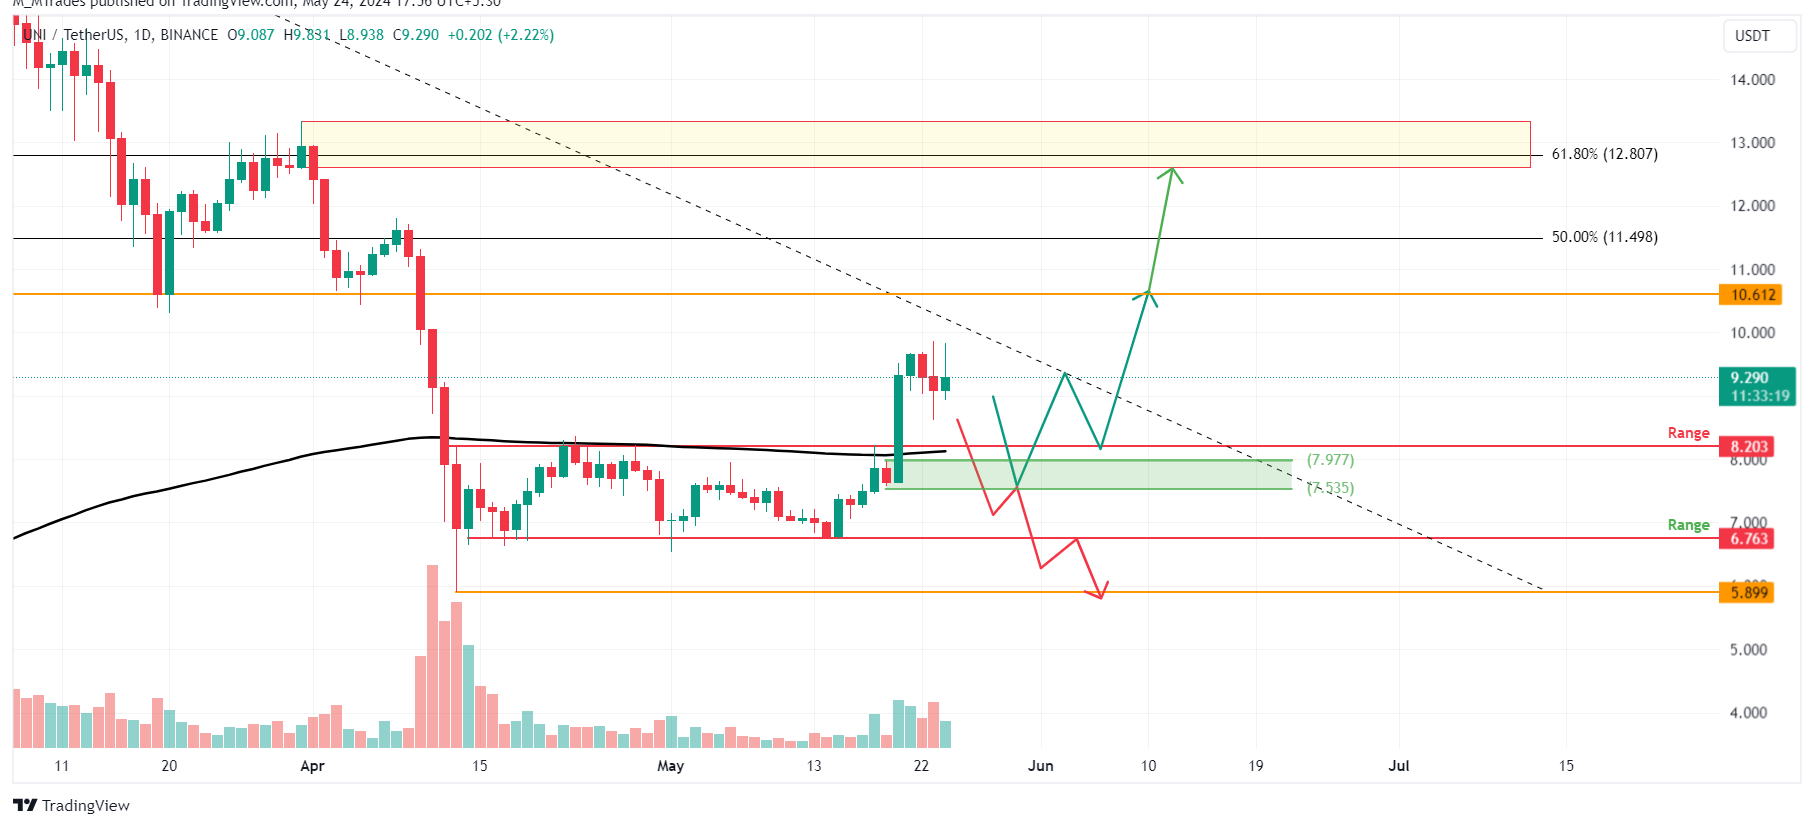
UNI/USDT 1-day chart

UNI/USDT 1-day chart

Santiment’s Age Consumed index is in line with the bullish outlook noted from a technical perspective. The spikes in this index suggest dormant tokens (tokens stored in wallets for a long time) are in motion and can be used to spot short-term local tops or bottoms.

For UNI, history shows that the spikes were followed by a rally in Uniswap price. The most recent uptick on April 25 also forecasted that UNI was ready for an uptrend.

UNI Age Consumed chart

UNI Age Consumed chart

Regardless of promising technical analysis and on-chain data, if the daily candlestick closes below the $6.76 price level, a lower low would be formed. This scenario would flip the bullish market structure to bearish, which could cause the UNI price to crash 13% to $5.89.

Haftungsausschluss: Nur zu Informationszwecken. Die bisherige Performance ist kein verlässlicher Indikator für zukünftige Ergebnisse.
placeholder
Ripple-Crash: 19 Mrd. weg! XRP steht vor dem gefährlichsten Punkt seit JahrenRipple (XRP) steckt in einer Phase, die viele Anleger nervös macht. Der Kurs hält sich zwar am Dienstag noch bei rund 2,25 US-Dollar, doch die Realität dahinter ist ernüchternd. Seit dem Rekordhoch von 3,66 US-Dollar am 18. Juli reiht sich ein Rückschlag an den nächsten.
Autor  FXStreet
Di. 18.Nov
Ripple (XRP) steckt in einer Phase, die viele Anleger nervös macht. Der Kurs hält sich zwar am Dienstag noch bei rund 2,25 US-Dollar, doch die Realität dahinter ist ernüchternd. Seit dem Rekordhoch von 3,66 US-Dollar am 18. Juli reiht sich ein Rückschlag an den nächsten.
placeholder
Top 3 Kursprognosen: Bitcoin, Ethereum, Ripple – BTC, ETH und XRP stemmen sich nach scharfer Korrektur gegen den AbwärtsdruckBitcoin (BTC) stabilisiert sich nach einem Rutsch unter 90.000 US-Dollar, Ethereum (ETH) verteidigt die Unterstützung bei 3.017 US-Dollar und XRP versucht nach einer Korrektur um 6–7 % eine Erholung – die Schlüsselmarken entscheiden über die nächste Bewegungsrichtung.
Autor  Mitrade Team
Mi. 19.Nov
Bitcoin (BTC) stabilisiert sich nach einem Rutsch unter 90.000 US-Dollar, Ethereum (ETH) verteidigt die Unterstützung bei 3.017 US-Dollar und XRP versucht nach einer Korrektur um 6–7 % eine Erholung – die Schlüsselmarken entscheiden über die nächste Bewegungsrichtung.
placeholder
Silberpreis entfernt sich vom Wochenhoch – 50-Dollar-Zone bleibt die entscheidende TrennlinieSilber (XAG/USD) nimmt nach einem Anstieg bis 51,85 US-Dollar Abstand vom Wochenhoch, während die gebündelte Unterstützungszone um 50,00 US-Dollar mit den Marken 49,35/49,00 und 47,15–47,10 US-Dollar nach unten sowie 52,45, 53,00 und bis knapp 54,40 US-Dollar nach oben den Handlungsrahmen für kurzfristige Trader absteckt.
Autor  Mitrade Team
Gestern 03: 11
Silber (XAG/USD) nimmt nach einem Anstieg bis 51,85 US-Dollar Abstand vom Wochenhoch, während die gebündelte Unterstützungszone um 50,00 US-Dollar mit den Marken 49,35/49,00 und 47,15–47,10 US-Dollar nach unten sowie 52,45, 53,00 und bis knapp 54,40 US-Dollar nach oben den Handlungsrahmen für kurzfristige Trader absteckt.
placeholder
Goldpreis unter Druck: Zinssenkungshoffnungen schwinden, XAU/USD behauptet sich knapp unter 4.100 DollarDer Goldpreis (XAU/USD) pendelt zum Wochenschluss um 4.080 US-Dollar, nachdem starke US-Arbeitsmarktdaten die Zinssenkungsfantasie für Dezember deutlich gedämpft haben – während schwächere US-PMI-Daten und fortgesetzte Zentralbankkäufe dem Edelmetall neuen Rückenwind geben könnten.
Autor  Mitrade Team
vor 8 Stunden
Der Goldpreis (XAU/USD) pendelt zum Wochenschluss um 4.080 US-Dollar, nachdem starke US-Arbeitsmarktdaten die Zinssenkungsfantasie für Dezember deutlich gedämpft haben – während schwächere US-PMI-Daten und fortgesetzte Zentralbankkäufe dem Edelmetall neuen Rückenwind geben könnten.
placeholder
Bitcoin unter Druck: Der Kampf um die 90.000-Dollar-Marke und drohende AbwärtsrisikenBitcoin (BTC) ist unter 90.000 US-Dollar gefallen, handelt unter dem 100-Stunden-Durchschnitt und kämpft mit Widerständen bei 87.000, 89.000 und 91.000 US-Dollar, während Unterstützungen bei 85.500, 85.000, 83.200, 82.500 und insbesondere 80.000 US-Dollar über die nächsten Kursbewegungen entscheiden.
Autor  Mitrade Team
vor 4 Stunden
Bitcoin (BTC) ist unter 90.000 US-Dollar gefallen, handelt unter dem 100-Stunden-Durchschnitt und kämpft mit Widerständen bei 87.000, 89.000 und 91.000 US-Dollar, während Unterstützungen bei 85.500, 85.000, 83.200, 82.500 und insbesondere 80.000 US-Dollar über die nächsten Kursbewegungen entscheiden.
verbundene Finanzinstrumente
goTop
quote