NZD/USD Price Analysis: New Zealand Dollar weakens ahead of Q1GDP

Quelle Fxstreet
  • NZD/USD falls to near 0.6130 as the New Zealand Dollar exhibits weakness ahead of the Q1 GDP data.
  • The USD Index holds its immediate support of 105.00 in a holiday market mood.
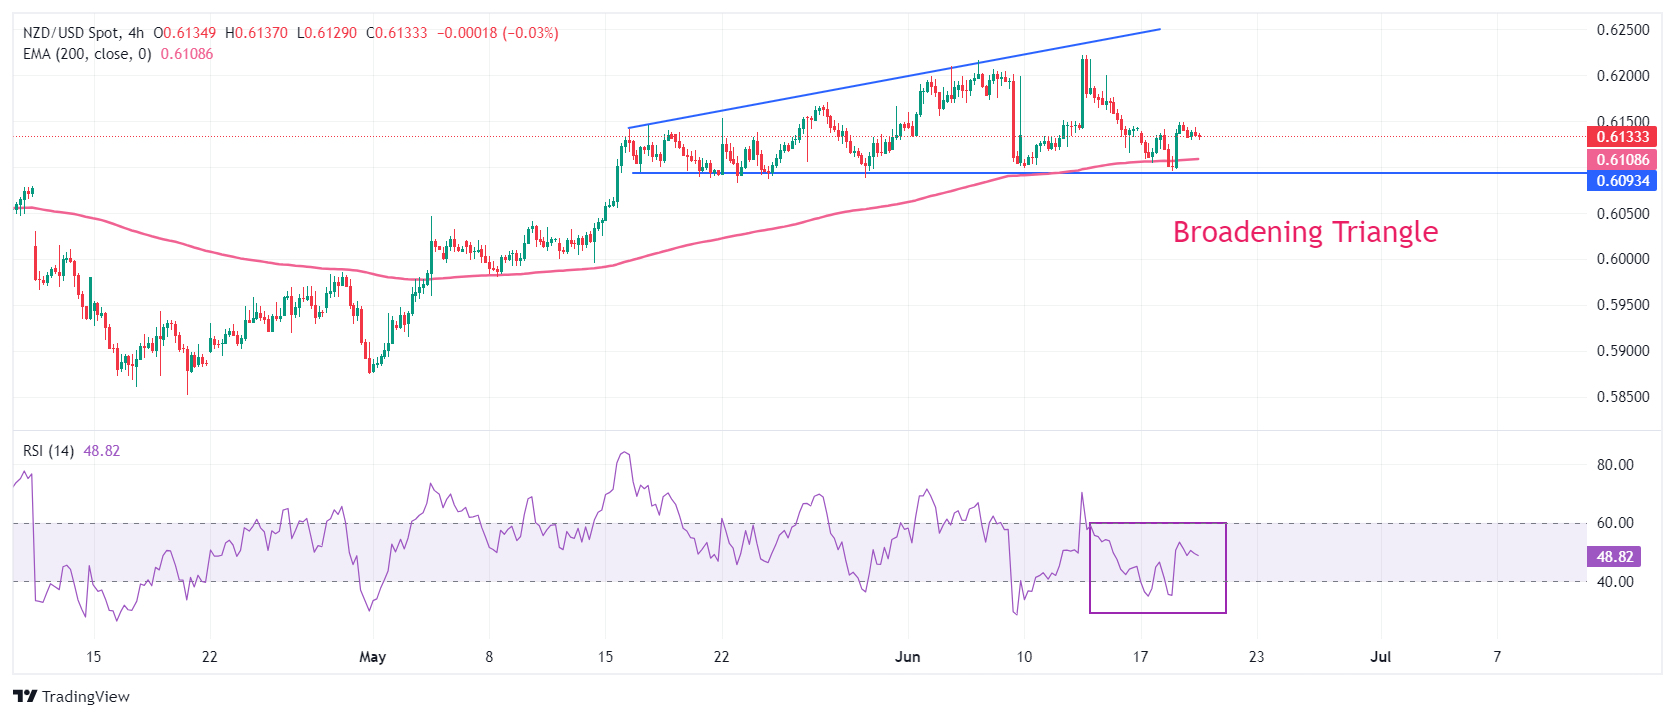
  • NZD/USD declines toward the horizontal support of the Broadening Triangle pattern.

The NZD/USD pair slumps to near 0.6130 in Wednesday’s American session. The Kiwi asset drops as the New Zaland Dollar comes under pressure ahead of the New Zealand (NZ) Q1 Gross Domestic Product (GDP) data, which will be published on Thursday. The NZ economy is estimated to have remained stagnant.

Weak economic performance would boost expectations of early rate cuts by the Reserve Bank of New Zealand (RBNZ). The RBNZ has been keeping its Official Cash Rate (OCR) higher at 5.5% for more than a year due to stubborn inflationary pressures.

Meanwhile, the US Dollar (USD) edges down in a thin volume trading session due to a holiday in United States (US) markets on account of Juneteenth. The US Dollar Index (DXY) holds its crucial support of 105.00. However, the near-term outlook has become uncertain as market participants expect the Federal Reserve (Fed) to cut interest rates twice this year.

This week, the US Dollar will be guided by preliminary S&P Global PMIs for June, which will be published on Thursday. The agency is expected to show a decline in the Composite PMI due to weakness in manufacturing as well as the service sector.

NZD/USD trades in a Broadening Triangle chart pattern on a four-hour timeframe in which the downside remains cushioned with the horizontal support, which is plotted from May 16 low around 0.6100. While the upside in the above-mentioned chart formation remains limited to the upward-sloping border, which in this case is marked from May 16 high around 0.6140.

The 200-period Exponential Moving Average (EMA) near 0.6101 continues to provide support to the New Zealand Dollar bulls.

The 14-period Relative Strength index (RSI) hovers near 40.00. A break below the same will trigger a bearish momentum.

Fresh downside would appear if the asset delivers a decisive break below the round-level support of 0.6100. This would drag the asset towards April 4 high around 0.6050 and psychological support of 0.6000.

On the contrary, a reversal move above June 12 high of 0.6222, which will expose the asset January 15 high near 0.6250, followed by January 12 high near 0.6280.

NZD/USD four-hour chart
NZD/USD

Overview
Today last price 0.6134
Today Daily Change -0.0009
Today Daily Change % -0.15
Today daily open 0.6143
 
Trends
Daily SMA20 0.6146
Daily SMA50 0.605
Daily SMA100 0.607
Daily SMA200 0.6063
 
Levels
Previous Daily High 0.6149
Previous Daily Low 0.6096
Previous Weekly High 0.6222
Previous Weekly Low 0.6099
Previous Monthly High 0.6171
Previous Monthly Low 0.5875
Daily Fibonacci 38.2% 0.6129
Daily Fibonacci 61.8% 0.6116
Daily Pivot Point S1 0.611
Daily Pivot Point S2 0.6076
Daily Pivot Point S3 0.6057
Daily Pivot Point R1 0.6163
Daily Pivot Point R2 0.6182
Daily Pivot Point R3 0.6216


Haftungsausschluss: Nur zu Informationszwecken. Die bisherige Performance ist kein verlässlicher Indikator für zukünftige Ergebnisse.
placeholder
Gold erreicht Zwei-Wochen-Hoch; zielt auf 4.200 $ während dovishe Fed USD-Anstieg und Risikobereitschaft ausgleichtGold zieht am Freitag während der asiatischen Sitzung frische Käufer an und klettert auf ein Zwei-Wochen-Hoch, während die Bullen nun darauf abzielen, die Marke von 4.200 USD zurückzuerobern, angesichts dovisher Erwartungen an die US-Notenbank (Fed)
Autor  FXStreet
vor 9 Stunden
Gold zieht am Freitag während der asiatischen Sitzung frische Käufer an und klettert auf ein Zwei-Wochen-Hoch, während die Bullen nun darauf abzielen, die Marke von 4.200 USD zurückzuerobern, angesichts dovisher Erwartungen an die US-Notenbank (Fed)
placeholder
Pi Network Preisprognose: PI fällt, da die Token-Freigabe im Dezember die Gaming-Partnerschaft überschattetDas Pi Network (PI) ist zum Zeitpunkt der Pressemitteilung am Freitag um 4% gefallen, nachdem es drei Tage lang einen Aufwärtstrend gab, der durch die Ankündigung der Partnerschaft mit CiDi Games am Mittwoch angeheizt wurde
Autor  FXStreet
vor 9 Stunden
Das Pi Network (PI) ist zum Zeitpunkt der Pressemitteilung am Freitag um 4% gefallen, nachdem es drei Tage lang einen Aufwärtstrend gab, der durch die Ankündigung der Partnerschaft mit CiDi Games am Mittwoch angeheizt wurde
placeholder
Zcash-Analyse: Überhitzung durch Kleinanleger – droht ein 30-Prozent-Absturz?Der Artikel zeigt, wie stagnierende Shielded-Pools, überhitztes Retail-Volumen und ein kritischer Test des 50-Tage-EMA bei 436 US-Dollar das Risiko eines über 30%igen Rückgangs bei Zcash erhöhen – und welche Marken für einen möglichen Rebound bis 600 bzw. 750 US-Dollar entscheidend sind.
Autor  Mitrade Team
vor 10 Stunden
Der Artikel zeigt, wie stagnierende Shielded-Pools, überhitztes Retail-Volumen und ein kritischer Test des 50-Tage-EMA bei 436 US-Dollar das Risiko eines über 30%igen Rückgangs bei Zcash erhöhen – und welche Marken für einen möglichen Rebound bis 600 bzw. 750 US-Dollar entscheidend sind.
placeholder
Bullen beißen sich an der 54,50-Dollar-Marke die Zähne ausDer Artikel analysiert, wie Silber nach einem Ein-Monats-Hoch ein mögliches Mehrfach-Top nahe 54,50 US-Dollar ausbildet, warum Rücksetzer in Richtung 53,00 und 52,70–52,65 US-Dollar vorerst als Kaufchance gelten und welche Widerstandsmarken zwischen 54,20 und 55,00 US-Dollar für eine Fortsetzung der Rally entscheidend sind.
Autor  Mitrade Team
vor 10 Stunden
Der Artikel analysiert, wie Silber nach einem Ein-Monats-Hoch ein mögliches Mehrfach-Top nahe 54,50 US-Dollar ausbildet, warum Rücksetzer in Richtung 53,00 und 52,70–52,65 US-Dollar vorerst als Kaufchance gelten und welche Widerstandsmarken zwischen 54,20 und 55,00 US-Dollar für eine Fortsetzung der Rally entscheidend sind.
placeholder
4.200 Dollar im Fadenkreuz – Zinsfantasie entfacht neue KaufwuchtDer Artikel analysiert den Anstieg des Goldpreises auf ein Zwei-Wochen-Hoch, die Rolle dovisher Fed-Erwartungen und geopolitischer Risiken sowie die zentralen Unterstützungs- und Widerstandsmarken rund um 4.170, 4.200 und 4.050–4.040 US-Dollar für die weitere Entwicklung von XAU/USD.
Autor  Mitrade Team
vor 10 Stunden
Der Artikel analysiert den Anstieg des Goldpreises auf ein Zwei-Wochen-Hoch, die Rolle dovisher Fed-Erwartungen und geopolitischer Risiken sowie die zentralen Unterstützungs- und Widerstandsmarken rund um 4.170, 4.200 und 4.050–4.040 US-Dollar für die weitere Entwicklung von XAU/USD.
verbundene Finanzinstrumente
goTop
quote