

WTI Price Prediction: Slides back below mid-$76.00s, not out of the woods yet
- WTI fails to build on the overnight recovery and meets with a fresh supply on Friday.
- Bearish traders need to wait for a break below the weekly low, around 75.70-$75.65.
- A sustained move and acceptance above 200-day SMA will negate the negative bias.
West Texas Intermediate (WTI) US crude Oil prices attract fresh sellers on Friday and erode a part of the previous day's modest recovery gains from the vicinity of the weekly low. The commodity remains depressed through the first half of the European session and currently trades below mid-$76.00s, down over 0.70% for the day.
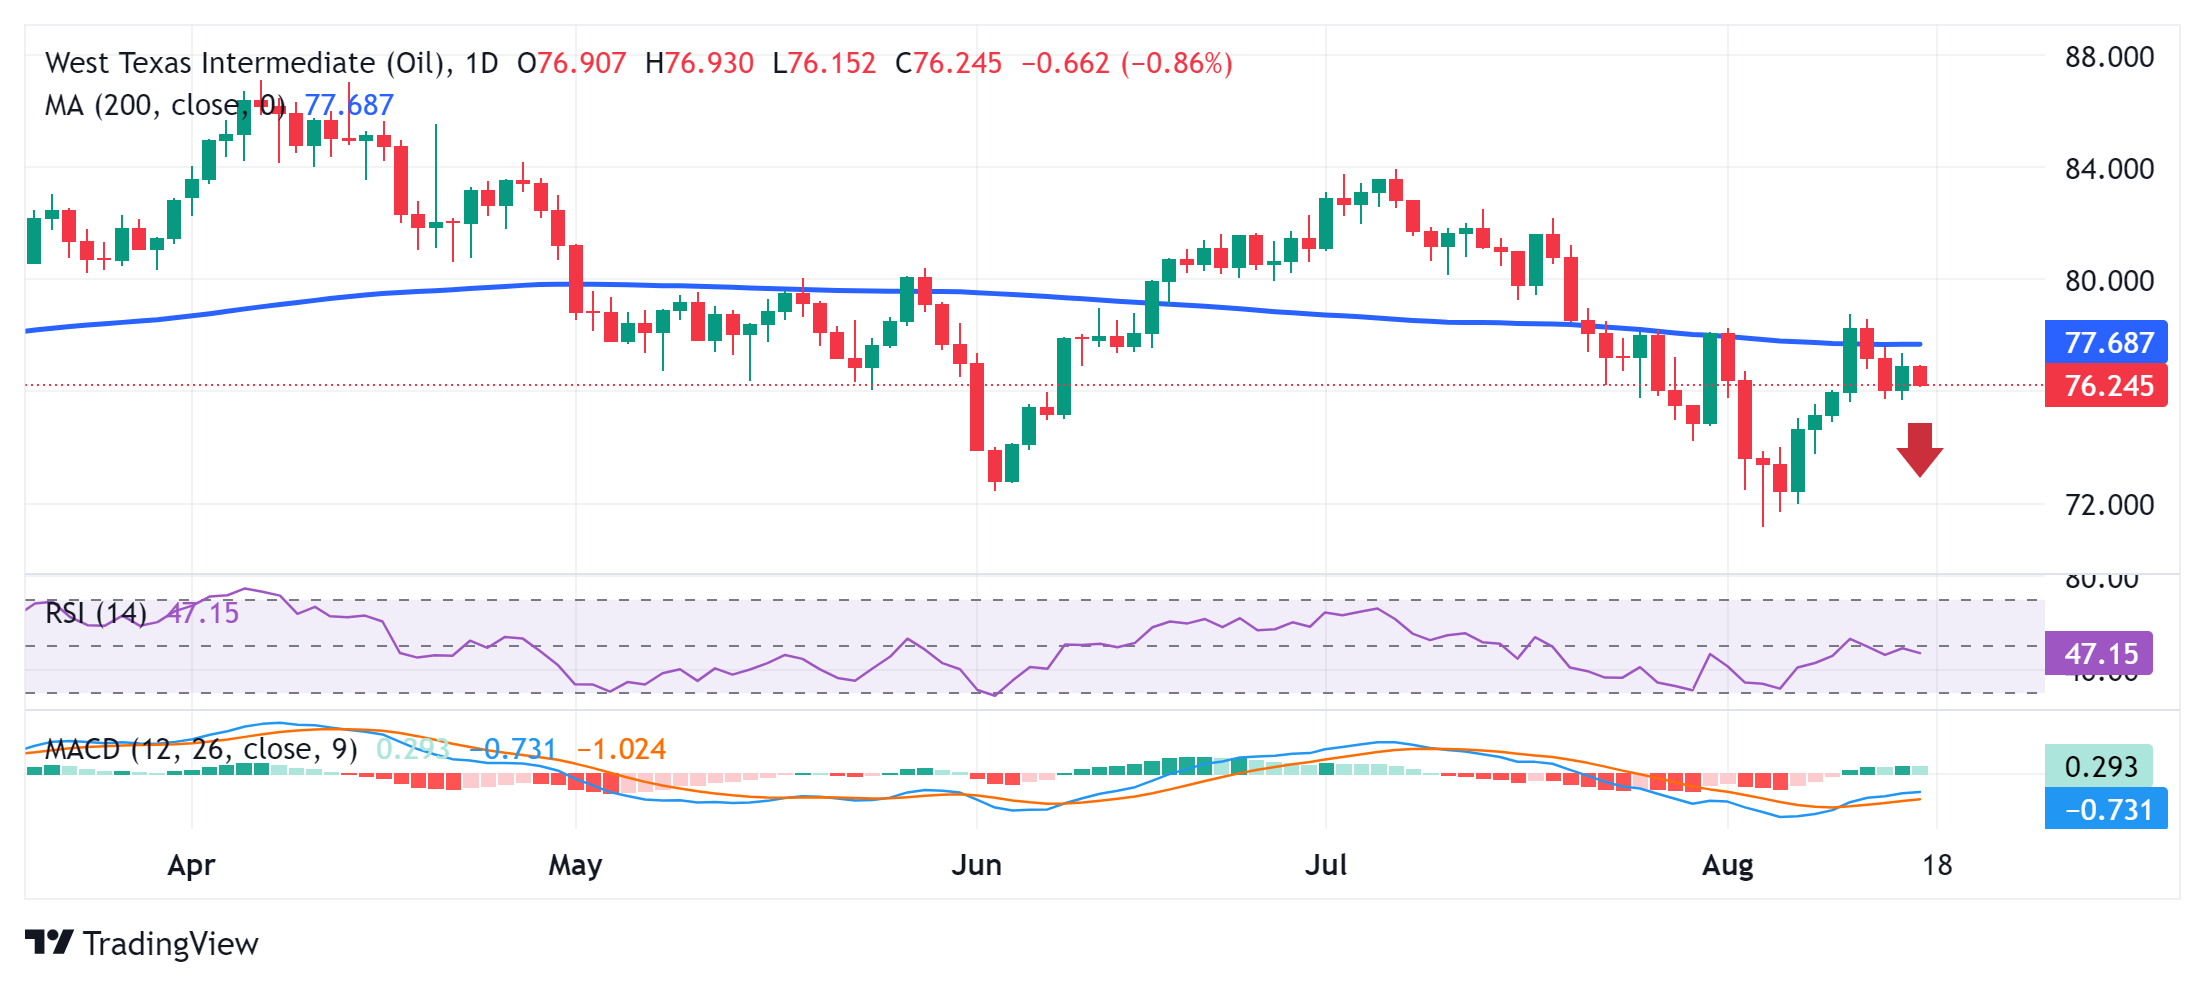
From a technical perspective, Crude Oil prices earlier this week struggled to capitalize on the move beyond the very important 200-day Simple Moving Average (SMA). The subsequent pullback from the monthly peak suggests that the recent recovery from the $71.20-$71.15 region, or the lowest level since January 17 touched last week, has run out of steam. That said, mixed oscillators on the daily chart warrant caution for bearish traders.
It will be prudent to wait for some follow-through selling below the $75.70-$75.65 region, or the weekly low, before positioning for any further depreciating move. Crude Oil prices might then accelerate the downfall towards the $75.00 psychological mark en route to the $74.25 area. The downward trajectory could eventually drag the commodity below the $74.00 mark, towards the next relevant support near the $73.45 region.
On the flip side, immediate resistance is pegged ahead of the $77.00 round figure mark. Any subsequent move up, meanwhile, might still be seen as a selling opportunity near the 200-day SMA, currently near the $77.80 region. This is followed by the $78.00 mark, the $78.20 supply zone and the monthly peak, around the $78.75-$78.80 area. Some follow-through buying will be seen as a fresh trigger for bulls and pave the way for further gains.
WTI daily chart
WTI Oil FAQs
WTI Oil is a type of Crude Oil sold on international markets. The WTI stands for West Texas Intermediate, one of three major types including Brent and Dubai Crude. WTI is also referred to as “light” and “sweet” because of its relatively low gravity and sulfur content respectively. It is considered a high quality Oil that is easily refined. It is sourced in the United States and distributed via the Cushing hub, which is considered “The Pipeline Crossroads of the World”. It is a benchmark for the Oil market and WTI price is frequently quoted in the media.
Like all assets, supply and demand are the key drivers of WTI Oil price. As such, global growth can be a driver of increased demand and vice versa for weak global growth. Political instability, wars, and sanctions can disrupt supply and impact prices. The decisions of OPEC, a group of major Oil-producing countries, is another key driver of price. The value of the US Dollar influences the price of WTI Crude Oil, since Oil is predominantly traded in US Dollars, thus a weaker US Dollar can make Oil more affordable and vice versa.
The weekly Oil inventory reports published by the American Petroleum Institute (API) and the Energy Information Agency (EIA) impact the price of WTI Oil. Changes in inventories reflect fluctuating supply and demand. If the data shows a drop in inventories it can indicate increased demand, pushing up Oil price. Higher inventories can reflect increased supply, pushing down prices. API’s report is published every Tuesday and EIA’s the day after. Their results are usually similar, falling within 1% of each other 75% of the time. The EIA data is considered more reliable, since it is a government agency.
OPEC (Organization of the Petroleum Exporting Countries) is a group of 13 Oil-producing nations who collectively decide production quotas for member countries at twice-yearly meetings. Their decisions often impact WTI Oil prices. When OPEC decides to lower quotas, it can tighten supply, pushing up Oil prices. When OPEC increases production, it has the opposite effect. OPEC+ refers to an expanded group that includes ten extra non-OPEC members, the most notable of which is Russia.
Empfohlene Artikel


