

EUR/USD slips further back on Thursday as rate cut hopes dry up
- EUR/USD eases lower as risk-off flows bolster the Greenback.
- A spike in US Services PMIs reignite fears of sticky inflation.
- Fed rate cut hopes hinging in easing services inflation stumble.
EUR/USD headed lower on Thursday, driven closer to the 1.0800 handle after an unexpected upswing in US Services Purchasing Managers Index (PMI) figures sparked renewed fears of fewer Federal Reserve (Fed) rate cuts. This sent investors into the safe-haven US Dollar and deflated the Euro despite better-than-expected HCOB PMI figures earlier in the day.
European and US PMI figures on Thursday both beat market expectations, with figures broadly printing above expectations and improving on previous figures, but a higher-than-forecast upswing in US Services PMIs from 51.3 to 54.8 pummeled broad-market expectations for a Fed rate cut in September.
Forex Today: Data continues to rule the sentiment
According to the CME’s FedWatch Tool, rate traders are pricing in barely even odds of at least a quarter-point cut at the September Federal Open Market Committee (FOMC) meeting. Significantly lower than the 70% odds that were priced in at the beginning of the trading week, investors are grappling with the possibility of no Fed cuts in 2024.
Traders’ broad hopes for Fed rate trims have been slowly ground to a paste through 2024. In December, markets were broadly pricing in at least six rate cuts from the Fed through the end of the year. Fast forward to late May, and investors are scrambling to hold onto hopes of a single cut, potentially as late as December.
Friday brings a Gross Domestic Product (GDP) update for Germany, which is expected to hold steady at 0.2% for the first quarter. US Durable Goods Orders in April are slated to print during Friday’s US market session, and are forecast to backslide -0.8% MoM compared to the previous month’s 2.6%.
Euro PRICE This week
The table below shows the percentage change of Euro (EUR) against listed major currencies this week. Euro was the weakest against the US Dollar.
| USD | EUR | GBP | JPY | CAD | AUD | NZD | CHF | |
|---|---|---|---|---|---|---|---|---|
| USD | 0.51% | 0.05% | 0.88% | 0.83% | 1.34% | 0.56% | 0.58% | |
| EUR | -0.51% | -0.50% | 0.41% | 0.32% | 0.86% | 0.08% | 0.07% | |
| GBP | -0.05% | 0.50% | 0.76% | 0.82% | 1.34% | 0.56% | 0.55% | |
| JPY | -0.88% | -0.41% | -0.76% | -0.06% | 0.47% | -0.27% | -0.29% | |
| CAD | -0.83% | -0.32% | -0.82% | 0.06% | 0.47% | -0.24% | -0.25% | |
| AUD | -1.34% | -0.86% | -1.34% | -0.47% | -0.47% | -0.79% | -0.78% | |
| NZD | -0.56% | -0.08% | -0.56% | 0.27% | 0.24% | 0.79% | -0.01% | |
| CHF | -0.58% | -0.07% | -0.55% | 0.29% | 0.25% | 0.78% | 0.01% |
The heat map shows percentage changes of major currencies against each other. The base currency is picked from the left column, while the quote currency is picked from the top row. For example, if you pick the Euro from the left column and move along the horizontal line to the US Dollar, the percentage change displayed in the box will represent EUR (base)/USD (quote).
EUR/USD technical outlook
EUR/USD is waffling into reach of the 1.0800 handle, trading on the south side of the 200-hour Exponential Moving Average (EMA) at 1.0833. The Euro took an early run at a high bid on Thursday of 1.0860, but short pressure quickly dragged the Fiber down into fresh lows for the trading week.
On daily candlesticks, EUR/USD is getting dragged back into consolidation at the 200-day EMA at 1.0801, and the pair has declined for all but one of the last five trading days.
EUR/USD hourly chart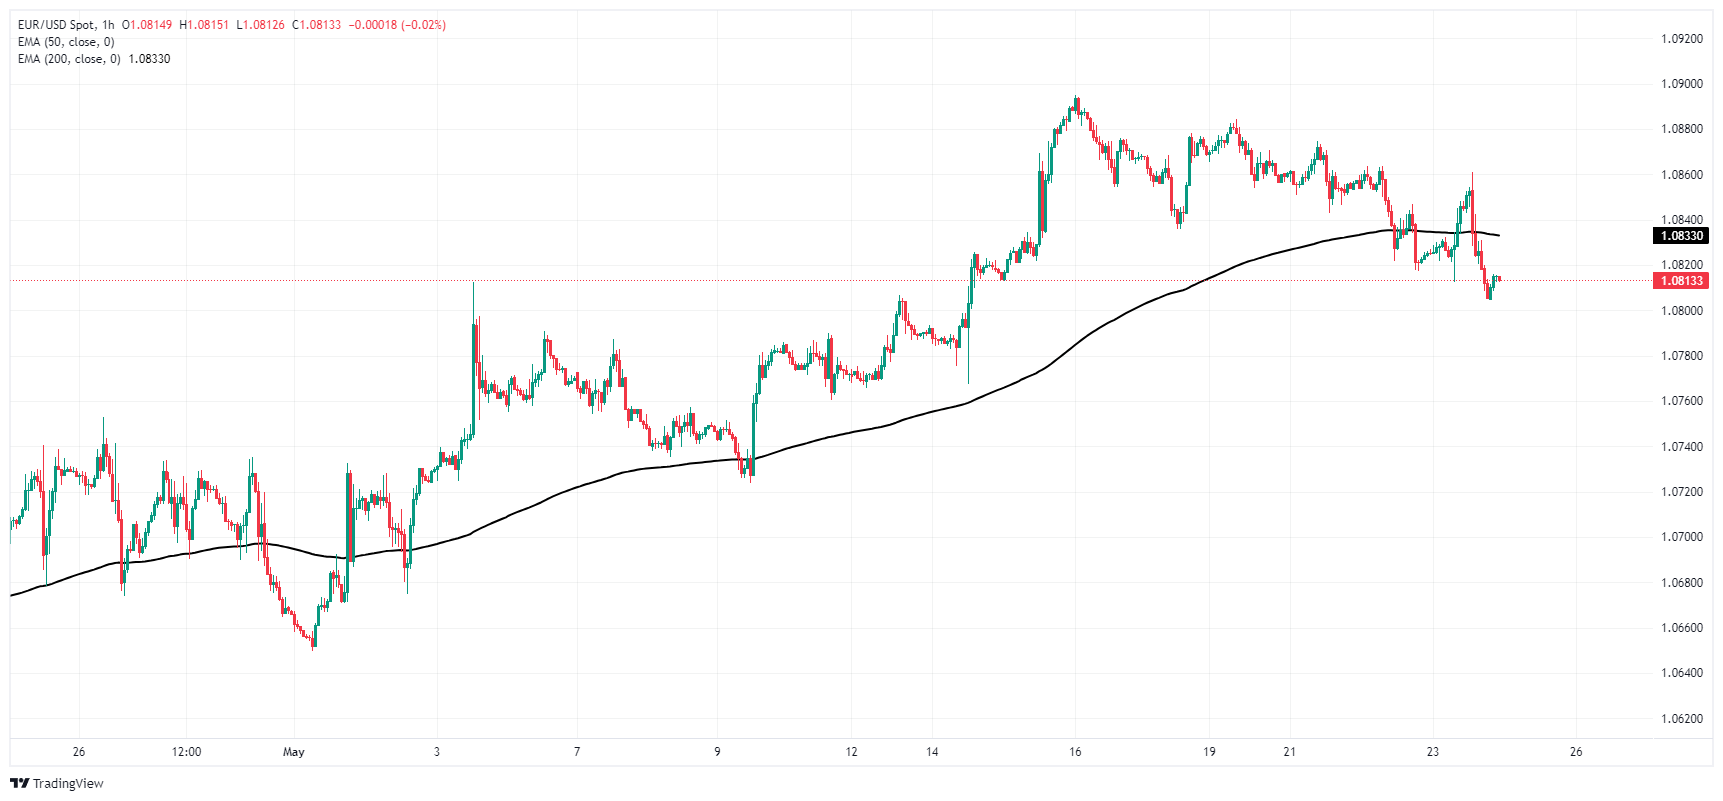
EUR/USD daily chart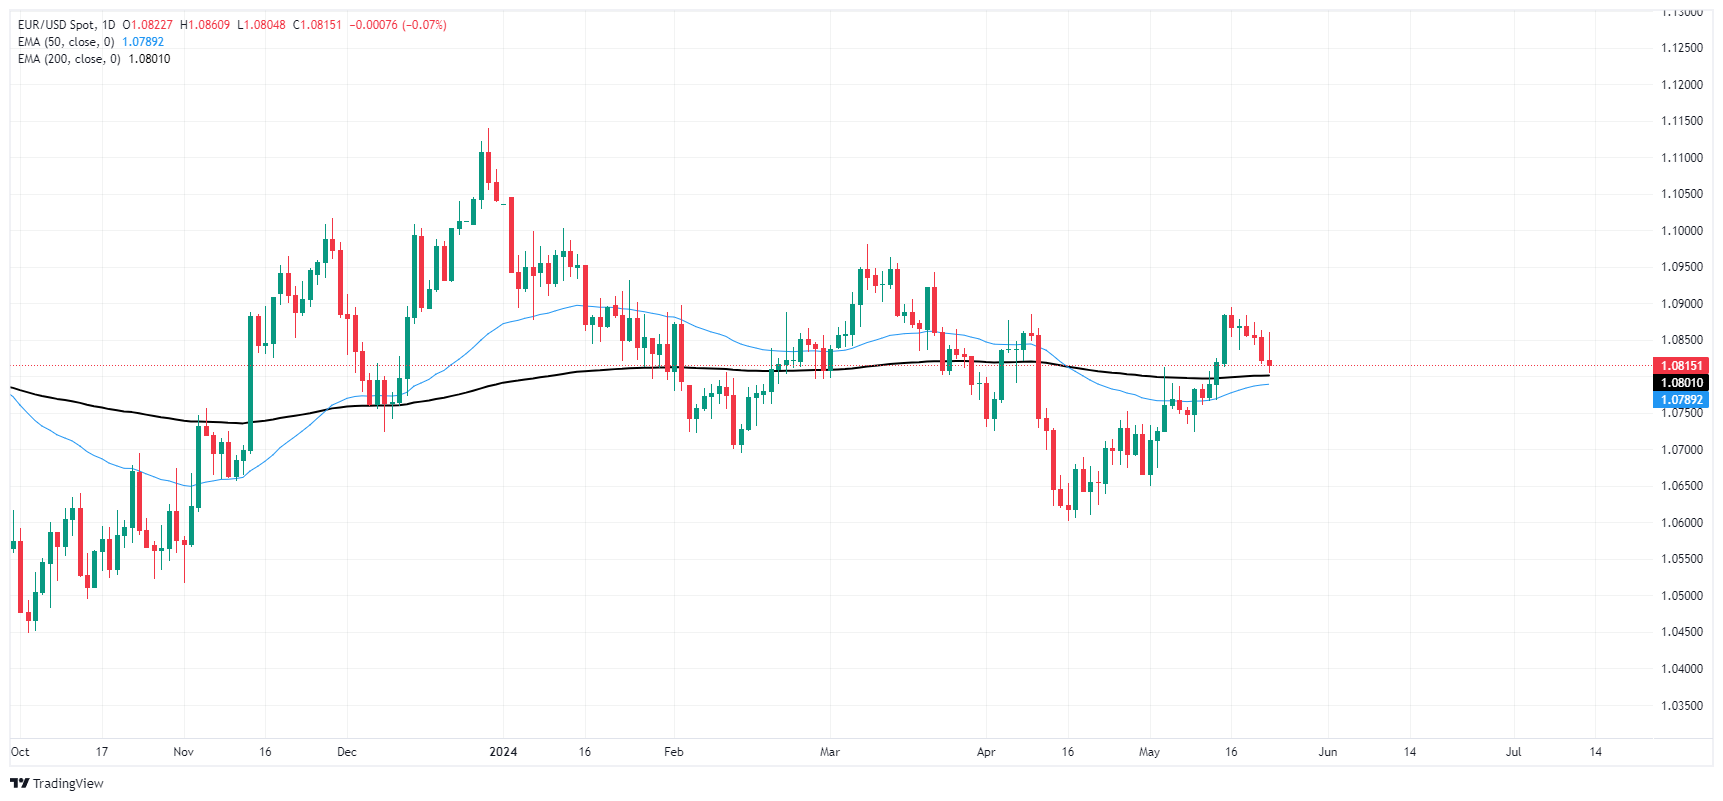
Empfohlene Artikel


