

Crude Oil shrugs off API stocks buildup, etches in another gain on Tuesday
- WTI climbed back above $80.00 on Tuesday as bullish recovery continues.
- Hopes of a summertime uptick in demand are bolstering Crude Oil bets.
- Energy traders are shrugging off another barrel buildup in API Crude Oil barrel counts.
West Texas Intermediate (WTI) US Crude Oil broke decisively above $80.00 per barrel on Tuesday as barrel traders shrugged off another build-up in American Petroleum Institute (API) Weekly Crude Oil Stocks. Energy markets are betting on an upswing in fossil fuel demand heading into summer to sop up extra supply throughout global Crude Oil markets, even as the Organization of the Petroleum Exporting Countries (OPEC) and its extended network of non-member ally states, OPEC , prepares to axe voluntary production cuts that were meant to support Crude Oil prices and crimp global supply.
According to the API, US Weekly Crude Oil Stocks rose 2.264 million barrels for the week ended June 14, clamping down on the previous week’s -2.428 million barrel drawdown. Distillate Stocks also rose 538K barrels, though Gasoline Stocks Change declined 1.077 million barrels, though significantly less than the previous week’s -2.549 million barrel drawdown. Investors with a calculator nearby will note that this week’s 2.264 million barrel addition to API weekly counts brings the supply overhang of US Crude Oil to over 17 million barrels since the first week of January 2024.
Geopolitical turmoil continues to attack a fear premium to Crude Oil markets after a Ukranian drone strike successfully ignited a Russian fuel tank facility this week, and Israel-Palestinian tensions continue to simmer. Coupled with ambiguous hopes of a summertime uptick in demand, energy markets are shrugging off bearish factors, like US Crude Oil overproduction and disappointing Chinese demand figures last week.
WTI technical outlook
US Crude Oil is accelerating into bullish territory as WTI pushes off rising technical support from the last notable swing low into $72.50. WTI crossed over $80.50 on Tuesday to test $80.70 as barrel traders push prices higher in a bid to capture previously lost territory.
This week’s bullish push in WTI has sent US Crude Oil above the 200-day Exponential Moving Average (EMA) at $78.86. WTI has also cracked a descending trendline drawn from 2024’s peak bids near $87.00, and a failed push higher could drag WTI bids back down to the $76.00 region.
WTI hourly chart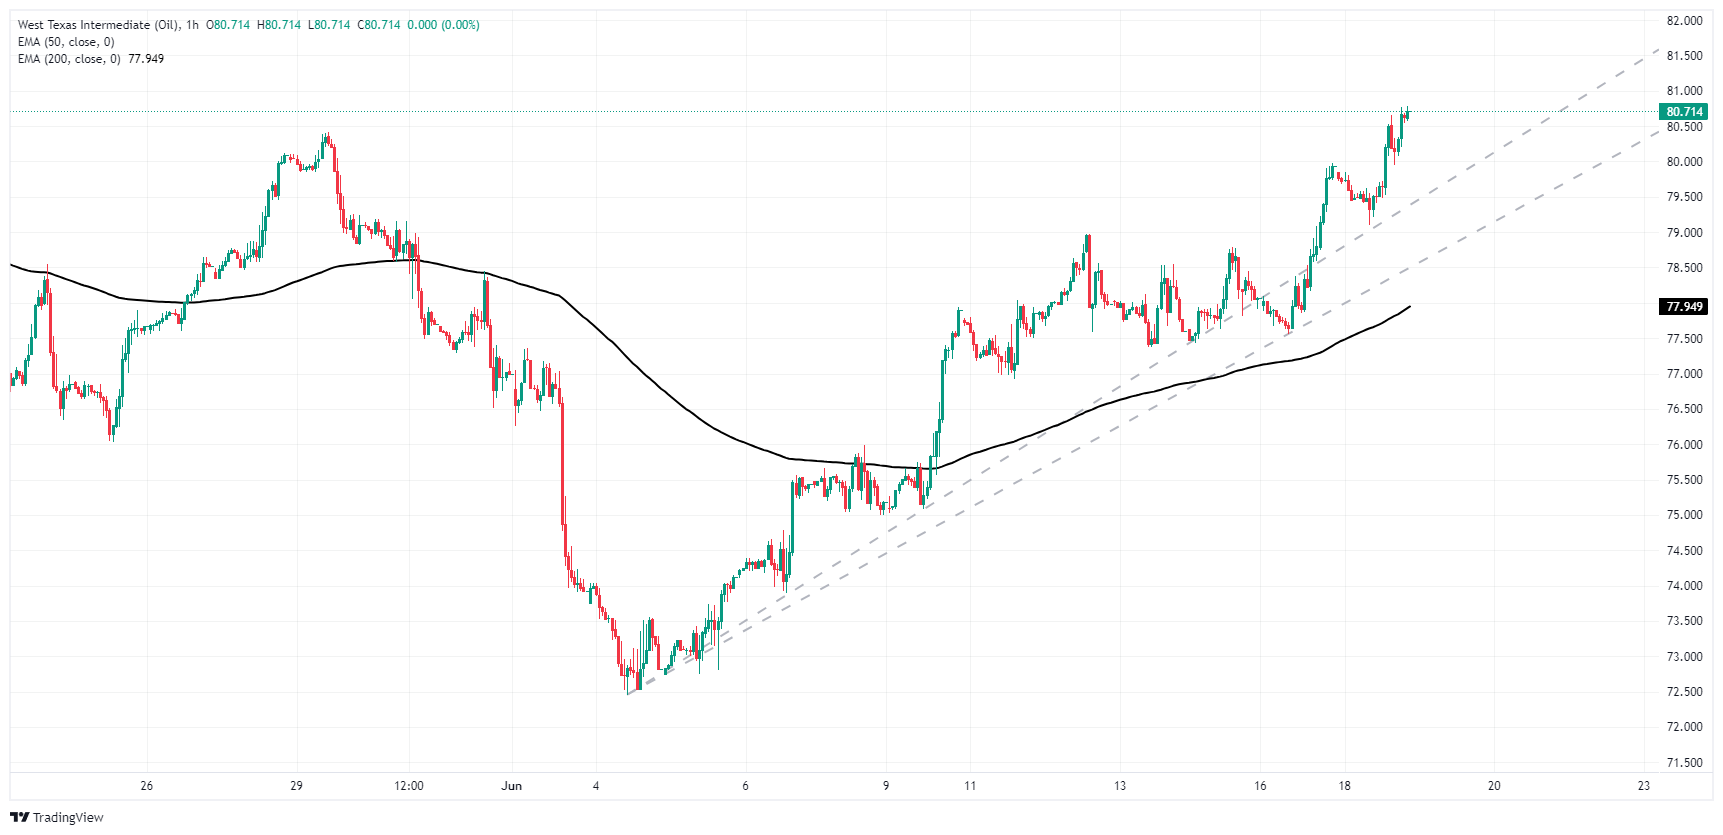
WTI daily chart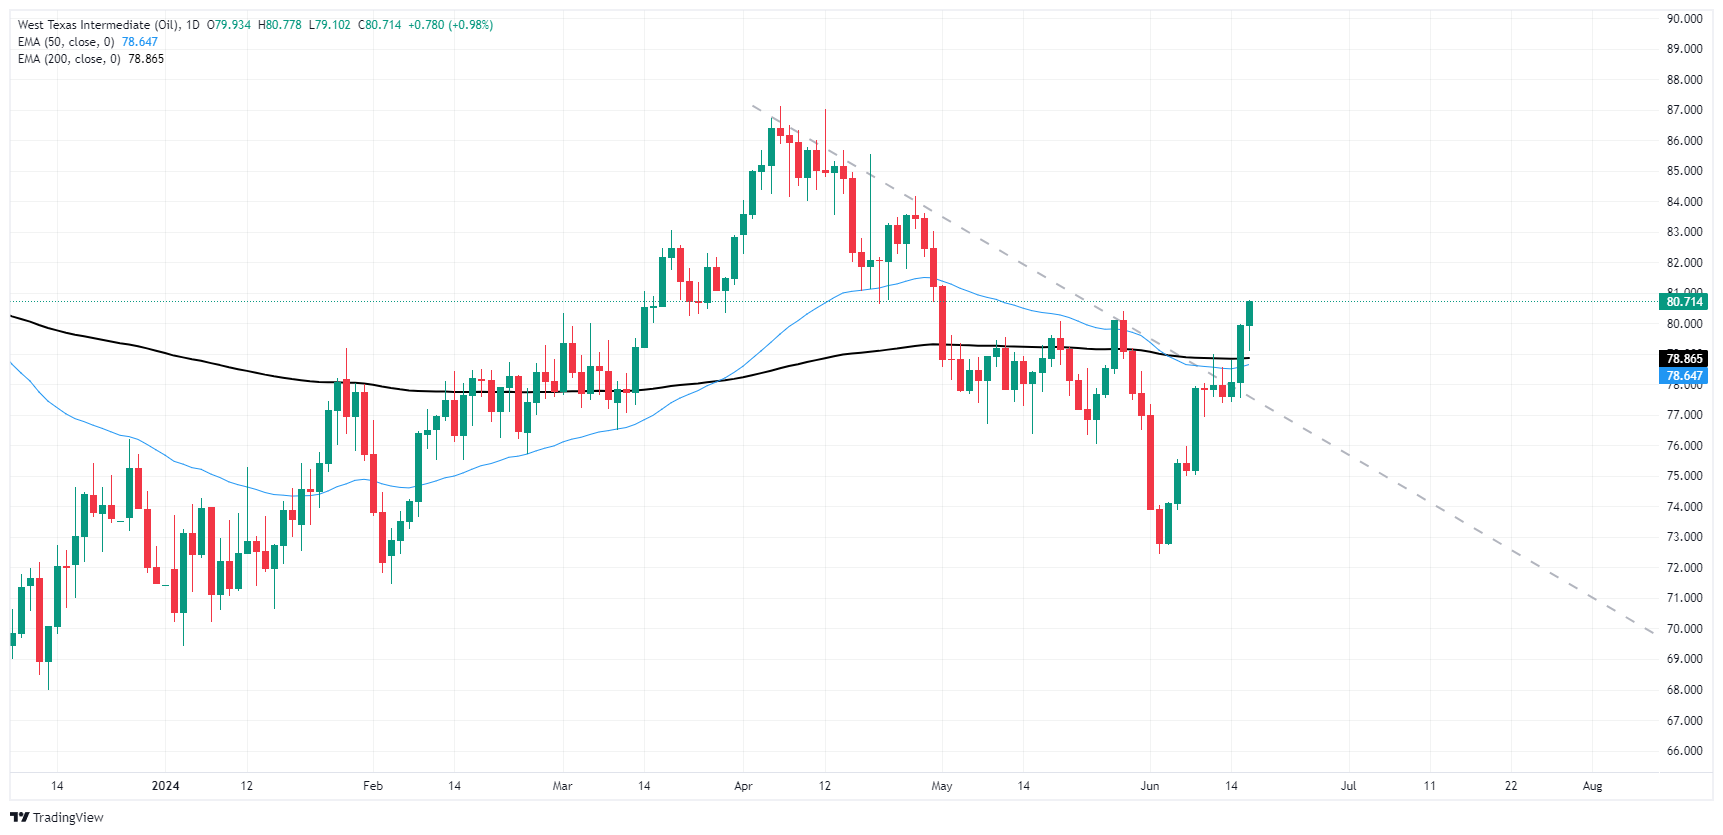
Empfohlene Artikel


