USD/JPY Price Forecast: Sticks to modest gains near mid-143.00s, not out of the woods yet

Quelle Fxstreet
  • USD/JPY gains positive traction for the second straight day, albeit lacks bullish conviction.
  • The formation of a descending channel points to a well-established short-term uptrend.
  • A move beyond the 144.00 mark is needed to support prospects for further appreciation. 

The USD/JPY pair attracts some buyers for the second straight day on Tuesday and trades around mid-143.00s during the first half of the European session. Spot prices, however, lack bullish conviction and remain below the overnight swing high as traders prefer to wait on the sidelines ahead of the crucial US inflation figures this week. 

In the meantime, a downward revision of the second quarter Gross Domestic Product (GDP) print continues to undermine the Japanese Yen (JPY) and acts as a tailwind for the USD/JPY pair amid a modest US Dollar (USD) uptick. That said, the divergent Federal Reserve (Fed)-Bank of Japan (BoJ) policy expectations hold back investors from placing aggressive bullish bets and cap the upside for the currency pair. 

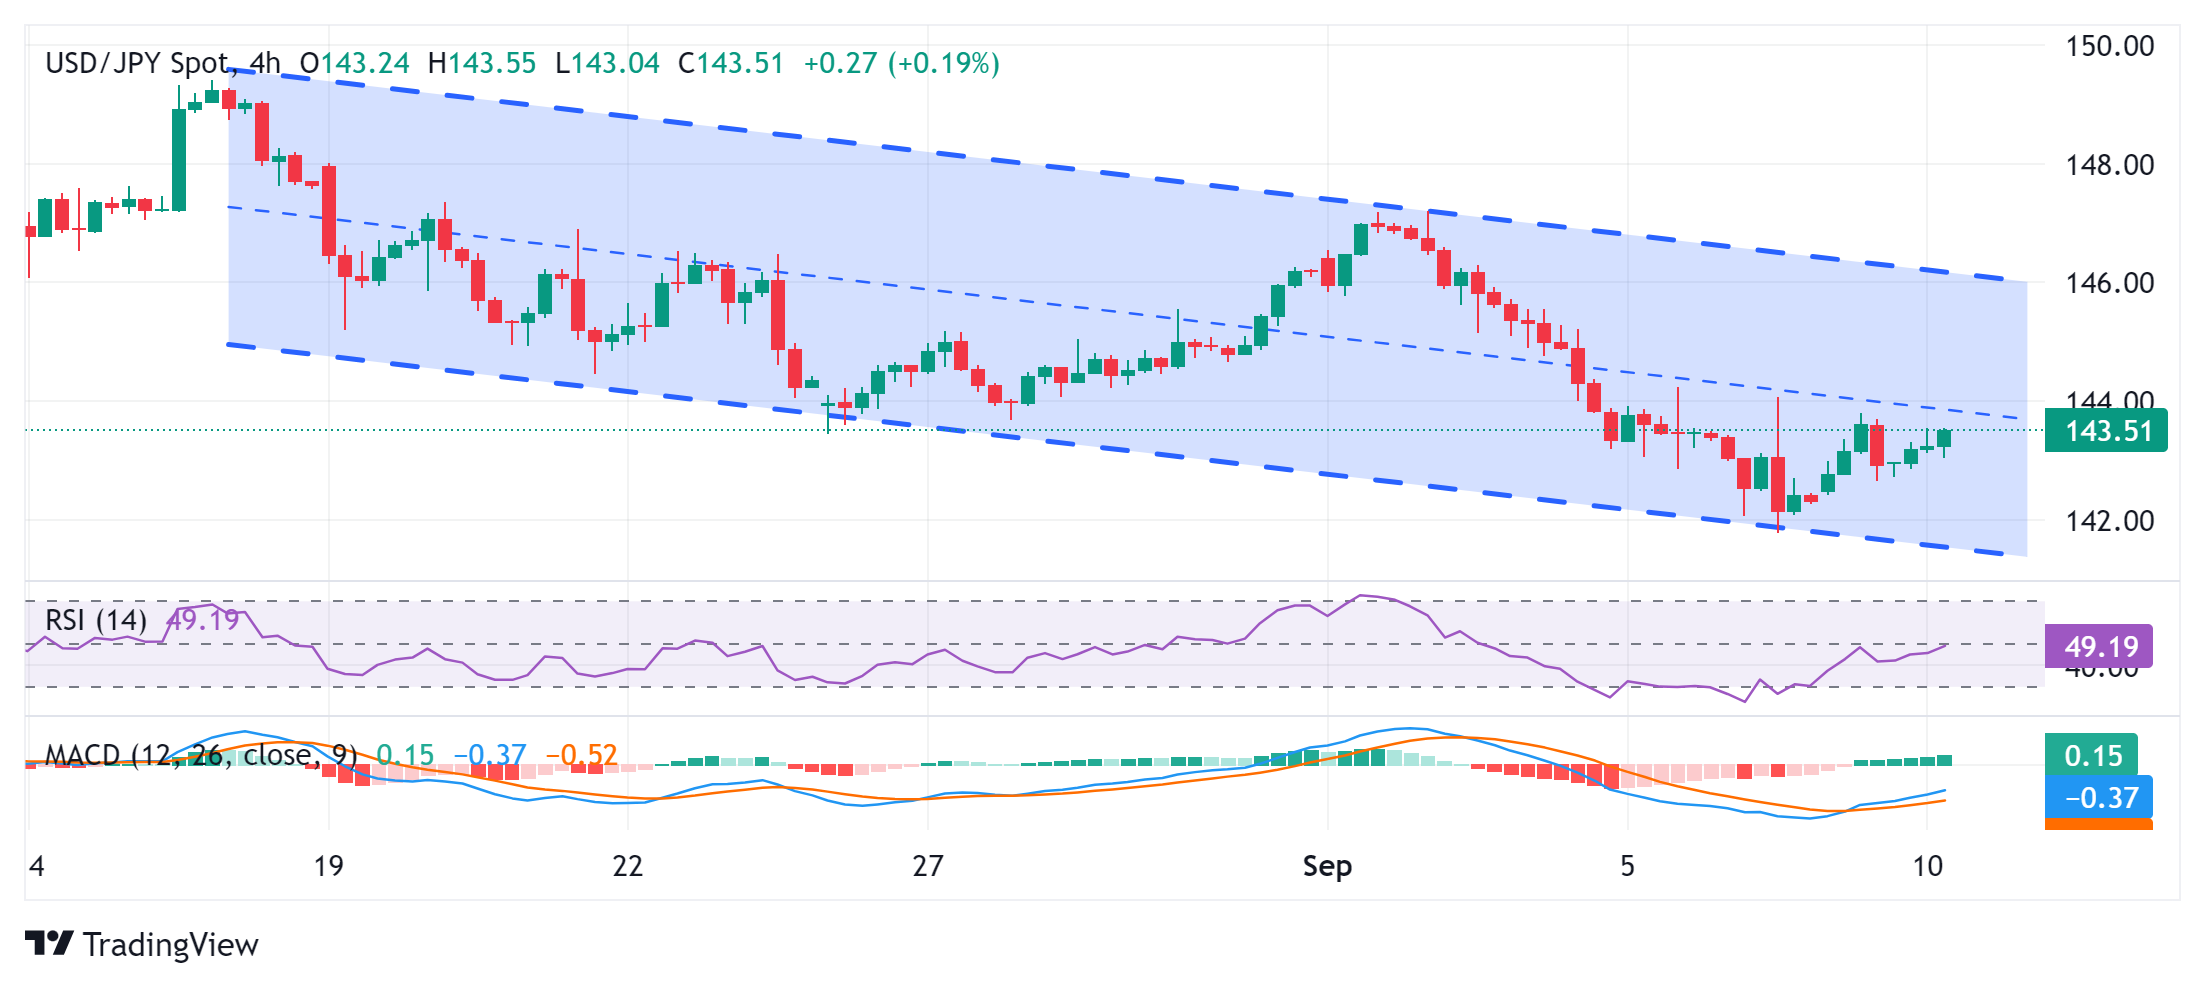
From a technical perspective, the recent downfall witnessed over the past four weeks or so has been along a descending channel. This points to a well-established short-term downtrend and supports prospects for the emergence of fresh selling at higher levels. The negative outlook is reinforced by the fact that oscillators on the daily chart are holding deep in negative territory and are still away from being in the oversold zone.

Hence, any subsequent move up might still be seen as a selling opportunity and remain capped near the 144.00 mark. That said, some follow-through buying could trigger a short-covering rally and lift the USD/JPY pair to the next relevant hurdle around the 144.55 region. The momentum could extend further towards reclaiming the 145.00 psychological mark before spot prices climb further toward the 145.60 resistance zone.

On the flip side, the 143.20 area is likely to protect the immediate downside ahead of the 143.00 mark and the Asian session low, around the 142.85 region. Failure to defend the said support levels will reaffirm the negative bias and expose the 142.00 round figure and a seven-month low, around the 141.70-141.65 region touched in August.

USD/JPY 4-hour chart

fxsoriginal

Japanese Yen FAQs

The Japanese Yen (JPY) is one of the world’s most traded currencies. Its value is broadly determined by the performance of the Japanese economy, but more specifically by the Bank of Japan’s policy, the differential between Japanese and US bond yields, or risk sentiment among traders, among other factors.

One of the Bank of Japan’s mandates is currency control, so its moves are key for the Yen. The BoJ has directly intervened in currency markets sometimes, generally to lower the value of the Yen, although it refrains from doing it often due to political concerns of its main trading partners. The current BoJ ultra-loose monetary policy, based on massive stimulus to the economy, has caused the Yen to depreciate against its main currency peers. This process has exacerbated more recently due to an increasing policy divergence between the Bank of Japan and other main central banks, which have opted to increase interest rates sharply to fight decades-high levels of inflation.

The BoJ’s stance of sticking to ultra-loose monetary policy has led to a widening policy divergence with other central banks, particularly with the US Federal Reserve. This supports a widening of the differential between the 10-year US and Japanese bonds, which favors the US Dollar against the Japanese Yen.

The Japanese Yen is often seen as a safe-haven investment. This means that in times of market stress, investors are more likely to put their money in the Japanese currency due to its supposed reliability and stability. Turbulent times are likely to strengthen the Yen’s value against other currencies seen as more risky to invest in.


Haftungsausschluss: Nur zu Informationszwecken. Die bisherige Performance ist kein verlässlicher Indikator für zukünftige Ergebnisse.
placeholder
Cardano rutscht unter $0.36 – Handelskonflikt EU–USA belastet Stimmung, Funding dreht ins NegativeCardano (ADA) fällt unter $0.36, nachdem der Kurs unter die Schlüsselunterstützung bei $0.38 gerutscht ist. EU–US-Handelsspannungen verstärken Risk-off-Stimmung; ADA-Funding Rate dreht auf -0.0079%. RSI bei 40 und MACD-Crossover signalisieren weitere Korrekturgefahr mit Zielen $0.32 und $0.27; Erholung erst bei Rücklauf Richtung 50-Tage-EMA ($0.41).
Autor  Mitrade Team
vor 14 Stunden
Cardano (ADA) fällt unter $0.36, nachdem der Kurs unter die Schlüsselunterstützung bei $0.38 gerutscht ist. EU–US-Handelsspannungen verstärken Risk-off-Stimmung; ADA-Funding Rate dreht auf -0.0079%. RSI bei 40 und MACD-Crossover signalisieren weitere Korrekturgefahr mit Zielen $0.32 und $0.27; Erholung erst bei Rücklauf Richtung 50-Tage-EMA ($0.41).
placeholder
Silber markiert neues Rekordhoch über $94 – Trend bleibt aufwärtsgerichtet, RSI überkauftSilber (XAG/USD) erreicht ein neues Allzeithoch bei $94.15 und handelt um $93.70. Der Aufwärtstrend im steigenden Kanal bleibt intakt, doch der 14-Tage-RSI bei 72.65 ist überkauft. Widerstände bei $96.80/$97.00, erste Unterstützung an der 9-Tage-EMA bei $87.05.
Autor  Mitrade Team
vor 14 Stunden
Silber (XAG/USD) erreicht ein neues Allzeithoch bei $94.15 und handelt um $93.70. Der Aufwärtstrend im steigenden Kanal bleibt intakt, doch der 14-Tage-RSI bei 72.65 ist überkauft. Widerstände bei $96.80/$97.00, erste Unterstützung an der 9-Tage-EMA bei $87.05.
placeholder
WTI hält sich stabil über 59,00 USD, während die Märkte die Spannungen mit dem Iran und Trumps Zollbedrohungen verdauenWest Texas Intermediate (WTI), der US-Rohöl-Benchmark, wird während der frühen europäischen Handelsstunden am Montag bei etwa 59,30 USD gehandelt. Der WTI-Preis bleibt stabil angesichts nachlassender Spannungen im Iran und einer breiteren Risikoscheu.
Autor  FXStreet
vor 15 Stunden
West Texas Intermediate (WTI), der US-Rohöl-Benchmark, wird während der frühen europäischen Handelsstunden am Montag bei etwa 59,30 USD gehandelt. Der WTI-Preis bleibt stabil angesichts nachlassender Spannungen im Iran und einer breiteren Risikoscheu.
placeholder
Meme-Coins unter Druck: DOGE, SHIB und PEPE im freien Fall – parallel zu Bitcoins RücksetzerDOGE, SHIB und PEPE setzen ihre Korrektur fort: DOGE fällt >3% und bleibt unter 20-/50-Tage-EMA ($0.1375/$0.1417), Support $0.1161. SHIB rutscht ~3% und visiert bei anhaltender Schwäche $0.00000678 an; Schlüsselzone $0.00000836. PEPE fällt 4%, unterschreitet die 50-Tage-EMA ($0.00000541) und riskiert bei Bruch von $0.00000500 eine Bewegung bis $0.00000363.
Autor  Mitrade Team
vor 16 Stunden
DOGE, SHIB und PEPE setzen ihre Korrektur fort: DOGE fällt >3% und bleibt unter 20-/50-Tage-EMA ($0.1375/$0.1417), Support $0.1161. SHIB rutscht ~3% und visiert bei anhaltender Schwäche $0.00000678 an; Schlüsselzone $0.00000836. PEPE fällt 4%, unterschreitet die 50-Tage-EMA ($0.00000541) und riskiert bei Bruch von $0.00000500 eine Bewegung bis $0.00000363.
placeholder
Kryptomarkt rutscht ab: Über $800 Mio. liquidiert – EU–US-Handelsstreit schaltet Märkte auf Risk-offDer Kryptomarkt korrigiert am Montag: Laut CoinGlass wurden in 24 Stunden über $800 million liquidiert (90.5% Longs). EU–US-Handelskrieg-Sorgen nehmen zu, EU prüft €93 billion ($101 billion) Gegenmaßnahmen; größte Einzelliquidation $25.83 million BTCUSD auf Hyperliquid, Fear-&-Greed-Index fällt auf 44 (von 61).
Autor  Mitrade Team
vor 16 Stunden
Der Kryptomarkt korrigiert am Montag: Laut CoinGlass wurden in 24 Stunden über $800 million liquidiert (90.5% Longs). EU–US-Handelskrieg-Sorgen nehmen zu, EU prüft €93 billion ($101 billion) Gegenmaßnahmen; größte Einzelliquidation $25.83 million BTCUSD auf Hyperliquid, Fear-&-Greed-Index fällt auf 44 (von 61).
verbundene Finanzinstrumente
goTop
quote