

GBP/USD Price Forecast: Reaches new multi-year high above 1.3200

Quelle Fxstreet
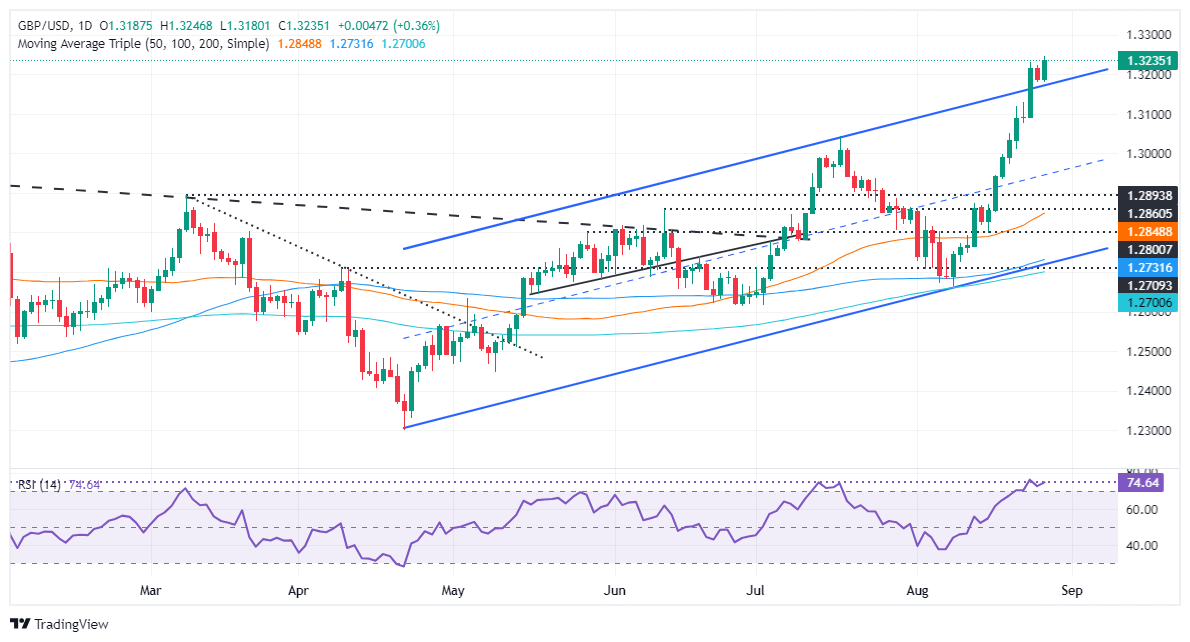
  • GBP/USD uptrend remains intact as long as it stays above 1.3043.
  • If buyers reclaim 1.3298, that will expose March 2022 peak at 1.3437.
  • A dip below 1.3200 will expose further support levels, like August 22, 1.3130 and the 1.3100 figure.

The Pound Sterling extended its gains and refreshed multi-year highs at around 1.3246 on Tuesday as the Greenback failed to recover following a surprisingly dovish tilt by Fed Chair Jerome Powell at his Jackson Hole speech. Investors increased their bets that the US central bank will lower rates at the September meeting, a tailwind for the GBP/USD. The pair exchanged hands at 1.3239 and is up by 0.40%.

GBP/USD Price Forecast: Technical outlook

The uptrend in the GBP/USD continues even though the Relative Strength Index (RSI) is overbought, which could cap the pair’s advance higher. Nevertheless, reclaiming the top trendline of an ascending channel could put into play the test of the March 22, 2022, peak at 1.3298 before challenging higher prices.

In that outcome, the GBP/USD's next resistance would be 1.3300. Once surpassed, the March 1, 2022, daily high would emerge at 1.3437.

Conversely, a dip below 1.3200 can send the GBP/USD towards the August 22 high at 1.3130 ahead of 1.3100. On further weakness, the next support would be the July 17 peak turned support at 1.3044.

GBP/USD Price Action – Daily Chart
British Pound PRICE Today

The table below shows the percentage change of British Pound (GBP) against listed major currencies today. British Pound was the strongest against the US Dollar.

  USD EUR GBP JPY CAD AUD NZD CHF
USD   -0.08% -0.38% -0.17% -0.27% -0.18% -0.50% -0.47%
EUR 0.08%   -0.30% -0.10% -0.20% -0.09% -0.45% -0.40%
GBP 0.38% 0.30%   0.21% 0.12% 0.21% -0.13% -0.09%
JPY 0.17% 0.10% -0.21%   -0.08% 0.00% -0.34% -0.30%
CAD 0.27% 0.20% -0.12% 0.08%   0.09% -0.25% -0.20%
AUD 0.18% 0.09% -0.21% -0.01% -0.09%   -0.35% -0.30%
NZD 0.50% 0.45% 0.13% 0.34% 0.25% 0.35%   0.03%
CHF 0.47% 0.40% 0.09% 0.30% 0.20% 0.30% -0.03%  

The heat map shows percentage changes of major currencies against each other. The base currency is picked from the left column, while the quote currency is picked from the top row. For example, if you pick the British Pound from the left column and move along the horizontal line to the US Dollar, the percentage change displayed in the box will represent GBP (base)/USD (quote).


Haftungsausschluss: Nur zu Informationszwecken. Die bisherige Performance ist kein verlässlicher Indikator für zukünftige Ergebnisse.
placeholder
Bitcoin-Preisprognose: Fed-Chef Warsh gibt Debüt in Jackson Hole, kann BTC die 83.000 USD durchbrechen?TradingKey – Fed-Chef Warsh gibt Jackson-Hole-Debüt: Kann Bitcoin das Momentum nutzen, um den starken Widerstand bei 83.000 US-Dollar zu durchbrechen?Am 28. August schwankte der Kurs von Bitcoin (BTC)
Autor  Mitrade Team
vor 11 Stunden
TradingKey – Fed-Chef Warsh gibt Jackson-Hole-Debüt: Kann Bitcoin das Momentum nutzen, um den starken Widerstand bei 83.000 US-Dollar zu durchbrechen?Am 28. August schwankte der Kurs von Bitcoin (BTC)
placeholder
WTI fällt unter 81,00 USD, da Gespräche zwischen Iran und Oman Hoffnungen auf eine Wiedereröffnung der Straße von Hormus schürenWest Texas Intermediate (WTI), die US-Rohöl-Benchmark, notiert am Donnerstag in den frühen europäischen Handelsstunden bei rund 80,90 USD. WTI rutscht ab, da die Hoffnungen auf eine Wiedereröffnung der Straße von Hormus angesichts diplomatischer Bemühungen unter Beteiligung des Iran und Omans wachsen.
Autor  FXStreet
Gestern 07: 31
West Texas Intermediate (WTI), die US-Rohöl-Benchmark, notiert am Donnerstag in den frühen europäischen Handelsstunden bei rund 80,90 USD. WTI rutscht ab, da die Hoffnungen auf eine Wiedereröffnung der Straße von Hormus angesichts diplomatischer Bemühungen unter Beteiligung des Iran und Omans wachsen.
placeholder
Goldpreis-Prognose: Die Rally läuft, doch jetzt wird es für Bullen gefährlichDer Goldpreis kennt seit Monaten fast nur eine Richtung. Seit September 2025 ging es um rund 20 % nach oben, inzwischen notiert Gold bei 4.701,34 US-Dollar. Eigentlich ein Bild, das Anleger freuen müsste.
Autor  FXStreet
Mi. 26.Aug
Der Goldpreis kennt seit Monaten fast nur eine Richtung. Seit September 2025 ging es um rund 20 % nach oben, inzwischen notiert Gold bei 4.701,34 US-Dollar. Eigentlich ein Bild, das Anleger freuen müsste.
placeholder
WTI fällt unter 84,00 $ aufgrund eines festeren USD, aber US-Iran-Spannungen begrenzen tiefere VerlusteWest Texas Intermediate (WTI) – der US-amerikanische Rohöl-Benchmarkpreis – zieht nach einem intraday-Anstieg in den Bereich von 85,35 USD neue Verkäufer an und dreht zum zweiten Mal in Folge nach unten. Der Rohstoff rutscht im frühen europäischen Handel unter 84,00 USD, obwohl das Abwärtspotenzial begrenzt zu sein scheint
Autor  FXStreet
Di. 25.Aug
West Texas Intermediate (WTI) – der US-amerikanische Rohöl-Benchmarkpreis – zieht nach einem intraday-Anstieg in den Bereich von 85,35 USD neue Verkäufer an und dreht zum zweiten Mal in Folge nach unten. Der Rohstoff rutscht im frühen europäischen Handel unter 84,00 USD, obwohl das Abwärtspotenzial begrenzt zu sein scheint
placeholder
Bitcoin vor neuem Bullenmarkt? Diese Signale machen Anleger jetzt hellhörigBitcoin (BTC) zeigt erste Anzeichen für einen möglichen Stimmungswechsel am Markt. Mehrere wichtige On-Chain-Indikatoren sind zuletzt in den bullischen Bereich gedreht.
Autor  FXStreet
Mo. 24.Aug
Bitcoin (BTC) zeigt erste Anzeichen für einen möglichen Stimmungswechsel am Markt. Mehrere wichtige On-Chain-Indikatoren sind zuletzt in den bullischen Bereich gedreht.
verbundene Finanzinstrumente
goTop
quote