AUD/JPY Price Analysis: Bulls take a breather, sellers test the 20-day SMA support

Quelle Fxstreet
  • The AUD/JPY pair is experiencing a decline as buyers take profits, causing it to hover around the 20-day SMA.
  • In spite of the drop, the pair remains in consolidation, suggesting the possibility of a limited decline for the time being.
  • If the bulls are successful in building support around the 20-day SMA, the next potential target lies within the 104.50-105.00 price range.

In Thursday's session, the AUD/JPY pair witnessed a dip towards 104.00 as buyers cashed in their profits, which saw the pair soaring above the 20-day Simple Moving Average (SMA). The 20-day SMA, which previously acted as a point of resistance, seems to be the new focus point for building support in order to lessen further losses. Nevertheless, the persistent consolidation phase suggests a lack of momentum for a steady rise.

The daily Relative Strength Index (RSI) of the AUDJPY now stands at 54, a decrease from the previous session's score of 57, indicating a slight downward trend and implying that the previous upward momentum may be losing steam. In contrast, the Moving Average Convergence Divergence (MACD) is exhibiting stationary red bars, indicative of a stabilizing momentum.

AUD/JPY daily chart
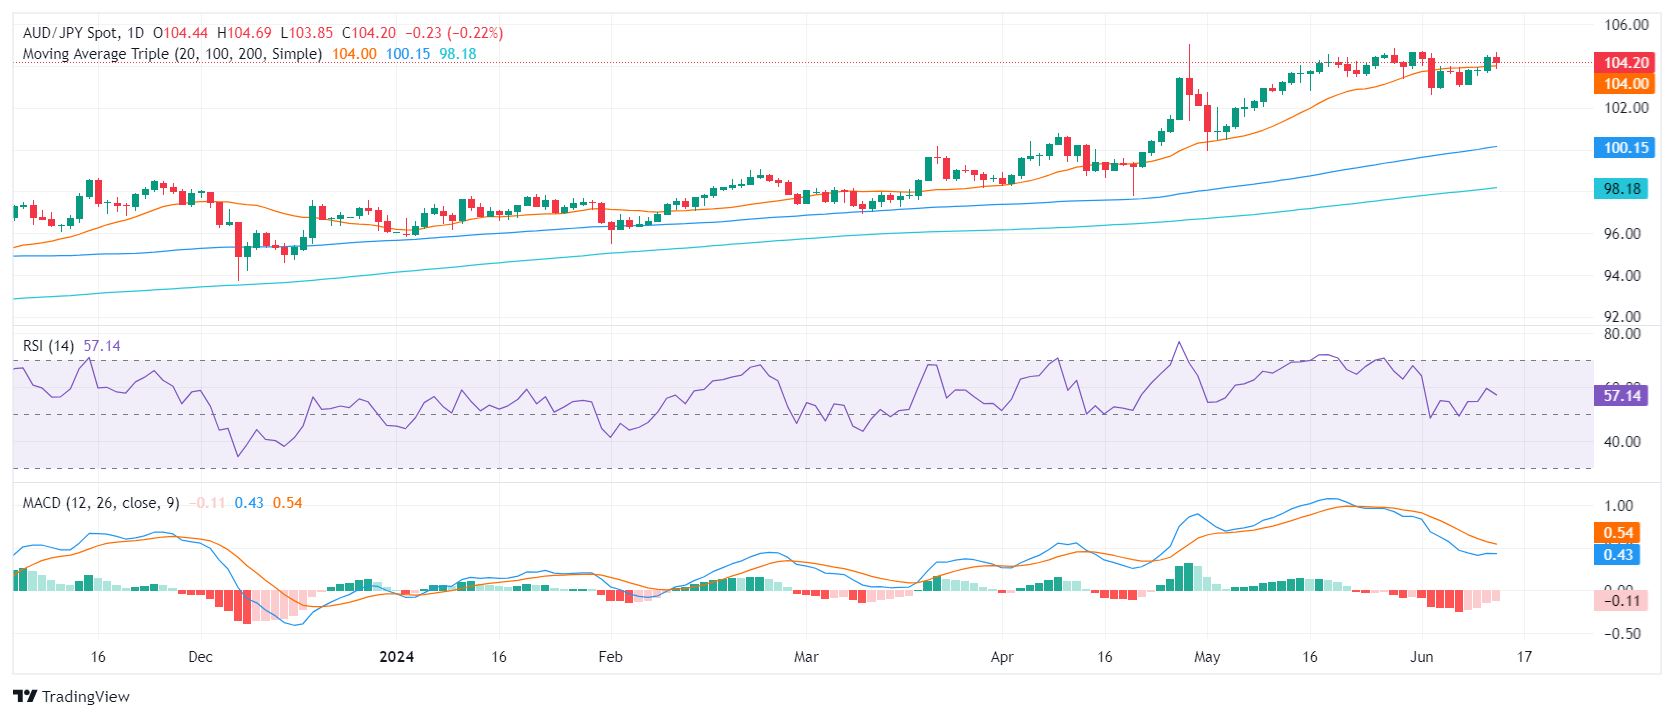
In conclusion, the AUD/JPY pair appears to be in a consolidation phase, despite a drop this Thursday as trading hovers around the 20-day SMA. The possible range of 102.00-103.00 for the upcoming sessions may denote the continuation of side-ways trading as bulls seem to be consolidating from the May rally which had lifted the pair near 105.00. Nonetheless, the reduction in selling momentum could represent a gearing up by the bulls for the next upward swing, potentially retesting the 104.50-105.00 area.


EUR/JPY

Overview
Today last price 168.61
Today Daily Change -0.79
Today Daily Change % -0.47
Today daily open 169.4
 
Trends
Daily SMA20 169.65
Daily SMA50 167.42
Daily SMA100 164.72
Daily SMA200 161.78
 
Levels
Previous Daily High 169.59
Previous Daily Low 168.66
Previous Weekly High 170.89
Previous Weekly Low 168.01
Previous Monthly High 170.8
Previous Monthly Low 164.02
Daily Fibonacci 38.2% 169.23
Daily Fibonacci 61.8% 169.02
Daily Pivot Point S1 168.85
Daily Pivot Point S2 168.29
Daily Pivot Point S3 167.92
Daily Pivot Point R1 169.77
Daily Pivot Point R2 170.14
Daily Pivot Point R3 170.7


Haftungsausschluss: Nur zu Informationszwecken. Die bisherige Performance ist kein verlässlicher Indikator für zukünftige Ergebnisse.
placeholder
Uniswap-Prognose: UNI hält Schlüsselunterstützung – Bullen nehmen wieder die OberhandUniswap (UNI) verteidigt die Unterstützung bei 7,06 US-Dollar und zeigt erste Erholungsansätze, gestützt durch Walakkumulation, Kaufdominanz und ein Long-Übergewicht im Futures-Handel.
Autor  Mitrade Team
vor 9 Stunden
Uniswap (UNI) verteidigt die Unterstützung bei 7,06 US-Dollar und zeigt erste Erholungsansätze, gestützt durch Walakkumulation, Kaufdominanz und ein Long-Übergewicht im Futures-Handel.
placeholder
Stellar-Prognose: XLM erholt sich – Bullen verteidigen zentrale UnterstützungStellar (XLM) verteidigt zu Wochenbeginn die wichtige Unterstützungszone um 0,253 US-Dollar, während On-Chain-Daten eine auffällige Akkumulation größerer Adressen und wachsende Kaufdominanz zeigen.
Autor  Mitrade Team
vor 10 Stunden
Stellar (XLM) verteidigt zu Wochenbeginn die wichtige Unterstützungszone um 0,253 US-Dollar, während On-Chain-Daten eine auffällige Akkumulation größerer Adressen und wachsende Kaufdominanz zeigen.
placeholder
Monero Kursprognose: XMR-Rallye gefährdet, da RSI bärische Divergenz signalisiertMonero (XMR) notiert am Montag unter 400 USD und verlängert den Verlust vom Vortag. Der intraday Pullback der Datenschutzmünze birgt das Risiko einer Doppelspitzen-Umkehr, da der RSI ein Verkaufssignal gibt
Autor  FXStreet
vor 10 Stunden
Monero (XMR) notiert am Montag unter 400 USD und verlängert den Verlust vom Vortag. Der intraday Pullback der Datenschutzmünze birgt das Risiko einer Doppelspitzen-Umkehr, da der RSI ein Verkaufssignal gibt
placeholder
Top 3 Krypto-Prognose: Bitcoin, Ethereum, Ripple – Können BTC, ETH und XRP ihre Schlüsselunterstützungen verteidigen?Bitcoin, Ethereum und XRP starten die Woche direkt an wichtigen Unterstützungszonen: BTC testet 94.253 US-Dollar, ETH verteidigt 3.017 US-Dollar und XRP stabilisiert sich um 2,23 US-Dollar nach der jüngsten Korrektur.
Autor  Mitrade Team
vor 10 Stunden
Bitcoin, Ethereum und XRP starten die Woche direkt an wichtigen Unterstützungszonen: BTC testet 94.253 US-Dollar, ETH verteidigt 3.017 US-Dollar und XRP stabilisiert sich um 2,23 US-Dollar nach der jüngsten Korrektur.
placeholder
Ripple: XRP rutscht trotz ETF-Rekordstart weiter ab – kippt die Stimmung am Support?XRP fällt trotz Rekordstart des neuen US-Spot-ETFs XRPC weiter in Richtung 2,25 US-Dollar, während On-Chain-Daten ein Ein-Jahres-Tief beim „Supply in Profit“ und ein schwaches Futures-Open-Interest zeigen.
Autor  Mitrade Team
vor 11 Stunden
XRP fällt trotz Rekordstart des neuen US-Spot-ETFs XRPC weiter in Richtung 2,25 US-Dollar, während On-Chain-Daten ein Ein-Jahres-Tief beim „Supply in Profit“ und ein schwaches Futures-Open-Interest zeigen.
verbundene Finanzinstrumente
goTop
quote