NZD/JPY Price Analysis: Cross reached multi-year highs, upside appears limited

Quelle Fxstreet
  • Kiwi shows signs of fatigue against the Yen, after reaching highest level since June 2007 on Thursday.
  • Indicators on the daily chart suggest potential further consolidation, with trading confined between 95.00 and 97.00.
  • A retest of the 97.00 level is possible, but a breach is unlikely as buyers consolidate gains from the significant ascent in May.

On Thursday, the NZD/JPY pair exhibited signs of fatigue, following its advancement to the multi-year highs logged earlier in the week. Clearly, the technical landscape suggests an extension of the consolidation phase, potentially keeping the pair's upside movements capped below the psychological 97.00 level.

The daily Relative Strength Index (RSI) for NZD/JPY has slightly retreated to 59, indicative of a waning in the bullish momentum. The Moving Average Convergence Divergence (MACD) continues to print flat red bars, further endorsing the perspective of ongoing consolidation.

NZD/JPY daily chart

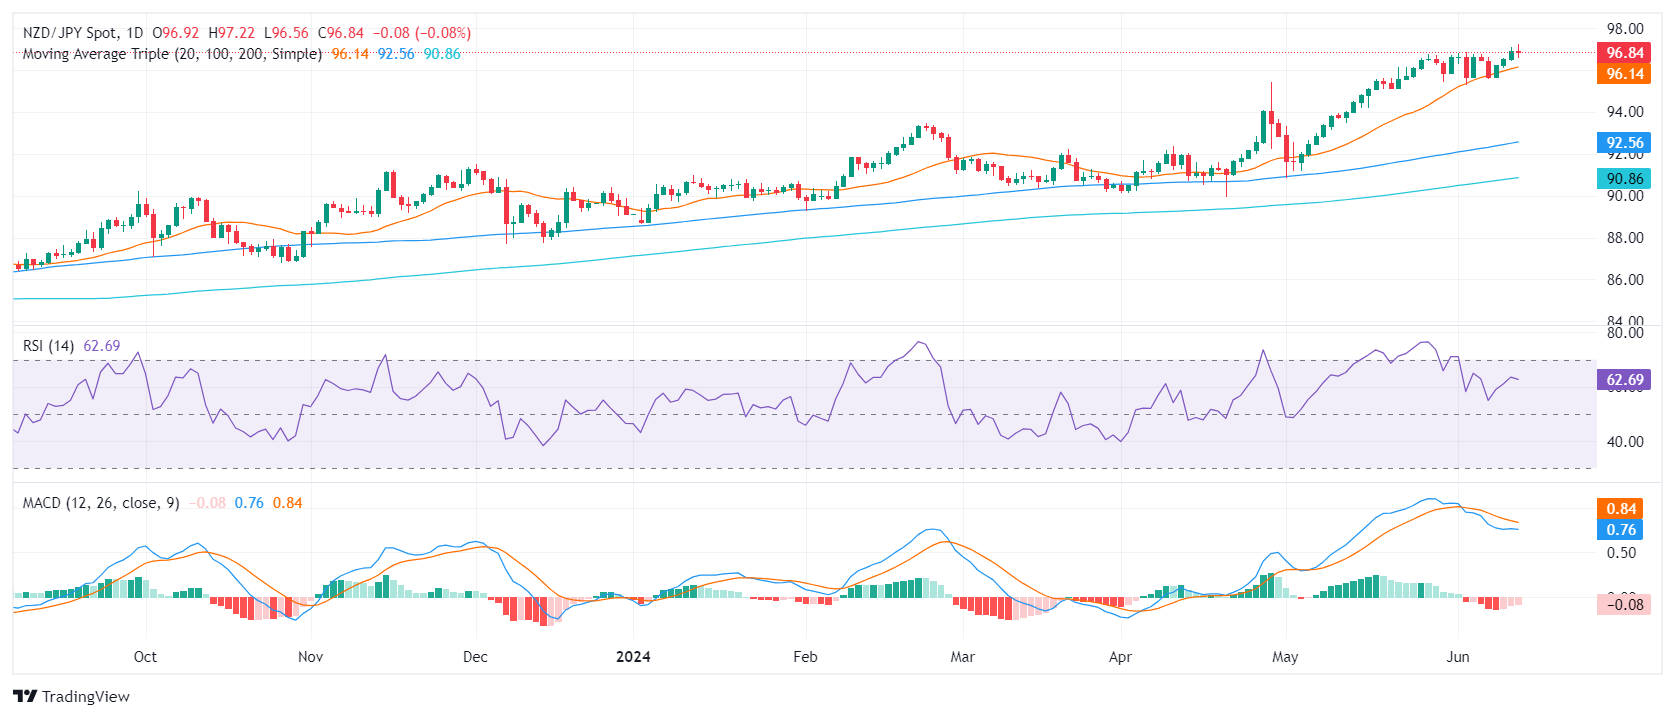
The continuous presence of buyers above the 20-day Simple Moving Average (SMA) indicates their effort to sustain the bullish push. Yet, the recent exhaustion signal demonstrated by the daily technical indicators supports the market's need to consolidate following the significant surge recorded in May. The upcoming trading sessions might see the pair oscillate between the 95.00 level, serving as support, and the 97.00 level, acting as resistance, as the pair looks to stabilize after recent gains.

The longer-term SMAs established around 90.00 - 92.00 safeguard the overall bullish complexion of the pair.


NZD/JPY

Overview
Today last price 96.83
Today Daily Change -0.09
Today Daily Change % -0.09
Today daily open 96.92
 
Trends
Daily SMA20 96.05
Daily SMA50 93.8
Daily SMA100 92.5
Daily SMA200 90.81
 
Levels
Previous Daily High 97.1
Previous Daily Low 96.41
Previous Weekly High 96.86
Previous Weekly Low 95.27
Previous Monthly High 96.74
Previous Monthly Low 90.83
Daily Fibonacci 38.2% 96.84
Daily Fibonacci 61.8% 96.67
Daily Pivot Point S1 96.52
Daily Pivot Point S2 96.11
Daily Pivot Point S3 95.82
Daily Pivot Point R1 97.21
Daily Pivot Point R2 97.5
Daily Pivot Point R3 97.9


Haftungsausschluss: Nur zu Informationszwecken. Die bisherige Performance ist kein verlässlicher Indikator für zukünftige Ergebnisse.
placeholder
Klimakiller KI: So plündern Big Techs unsere EnergiereservenInvesting.com – Der immense Stromverbrauch von Blockchains wie Bitcoin und Ethereum stand über viele Jahre hinweg im Fokus und wurde stets damit in Verbindung gebracht, wie umweltschädlich diese Techn
Autor  Investing.com
16.Jul. 2024
Investing.com – Der immense Stromverbrauch von Blockchains wie Bitcoin und Ethereum stand über viele Jahre hinweg im Fokus und wurde stets damit in Verbindung gebracht, wie umweltschädlich diese Techn
placeholder
Gold steigt aufgrund von Handelskriegsängsten, geopolitischen Risiken und einem schwächeren USD auf ein frisches MonatshochGold (XAU/USD) verzeichnete am Freitag den höchsten wöchentlichen Schlusskurs aller Zeiten, über der Marke von 5.100 USD, und gewinnt zu Beginn einer neuen Woche stark an Folge-Dynamik.
Autor  FXStreet
Mo. 23.Feb
Gold (XAU/USD) verzeichnete am Freitag den höchsten wöchentlichen Schlusskurs aller Zeiten, über der Marke von 5.100 USD, und gewinnt zu Beginn einer neuen Woche stark an Folge-Dynamik.
placeholder
Gold rückt angesichts geopolitischer Spannungen und USD-Schwäche wieder näher an die Marke von 5.200 $ heranGold (XAU/USD) zieht einige Dip-Käufer an, nachdem es am Vortag einen moderaten Pullback vom monatlichen Hoch gegeben hat, und klettert während des asiatischen Handels am Mittwoch näher an die Marke von 5.200 USD.
Autor  FXStreet
Gestern 06: 03
Gold (XAU/USD) zieht einige Dip-Käufer an, nachdem es am Vortag einen moderaten Pullback vom monatlichen Hoch gegeben hat, und klettert während des asiatischen Handels am Mittwoch näher an die Marke von 5.200 USD.
placeholder
Goldpreis Prognose: 75 Prozent Rally! Droht jetzt der Absturz?Der Goldpreis hat Anleger in den vergangenen Monaten elektrisiert. Erst der Durchbruch über die magische Marke von 5.000 US-Dollar, dann neue Hochs – und jetzt der Dämpfer.
Autor  FXStreet
Gestern 06: 45
Der Goldpreis hat Anleger in den vergangenen Monaten elektrisiert. Erst der Durchbruch über die magische Marke von 5.000 US-Dollar, dann neue Hochs – und jetzt der Dämpfer.
placeholder
Gold bleibt positiv gestimmt angesichts eines schwächeren USD und der Nachfrage nach sicheren Häfen vor den US-Iran-GesprächenGold (XAU/USD) zieht einige Dip-Käufer an, nachdem es am Vortag zu einem späten Pullback kam, und klettert während des asiatischen Handels am Donnerstag näher an die Marke von 5.200 USD.
Autor  FXStreet
vor 7 Stunden
Gold (XAU/USD) zieht einige Dip-Käufer an, nachdem es am Vortag zu einem späten Pullback kam, und klettert während des asiatischen Handels am Donnerstag näher an die Marke von 5.200 USD.
verbundene Finanzinstrumente
goTop
quote