NZD/USD Price Analysis: Bulls maintain momentum, eyes on bullish crossover

Quelle Fxstreet
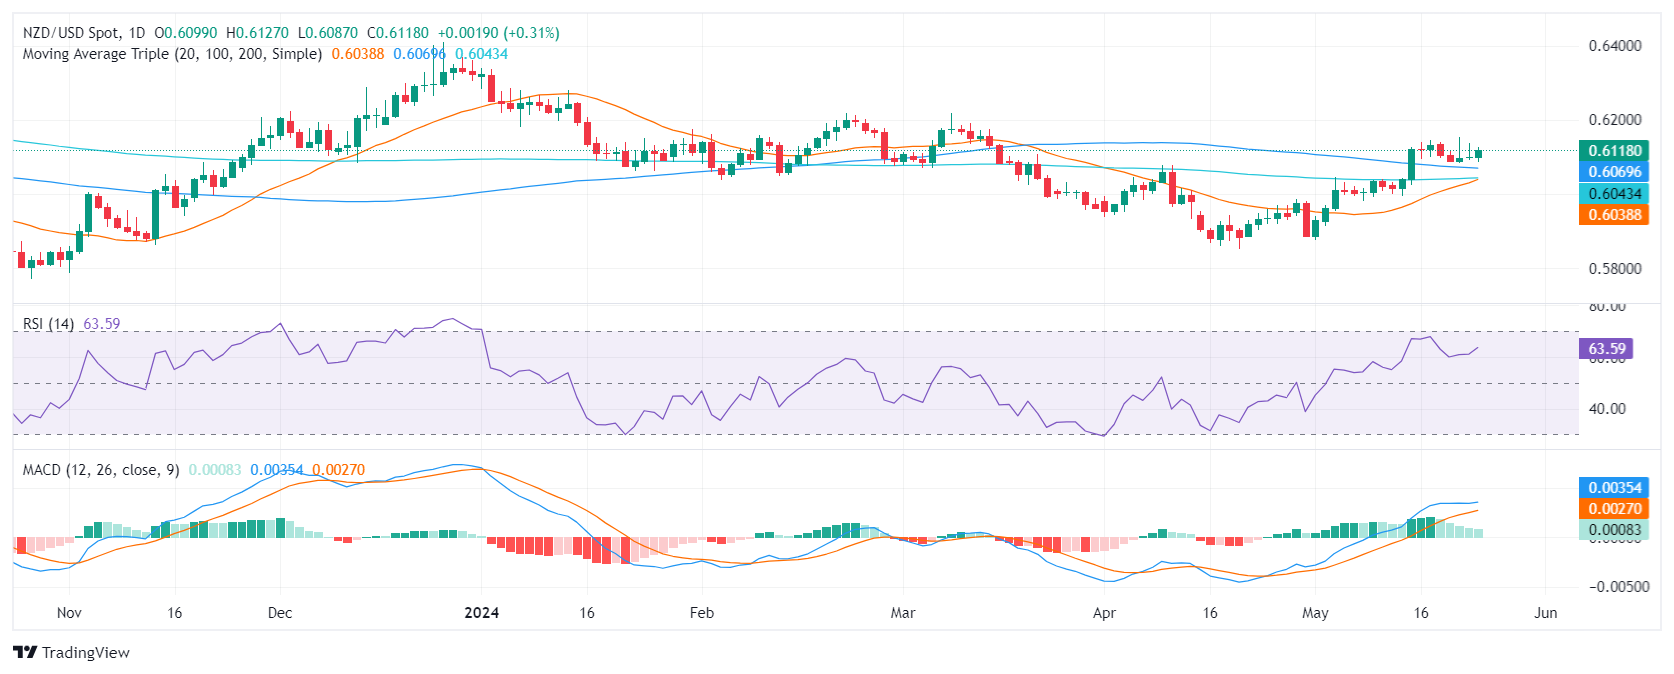
  • The daily indicators remain in positive territory but somewhat flattened .
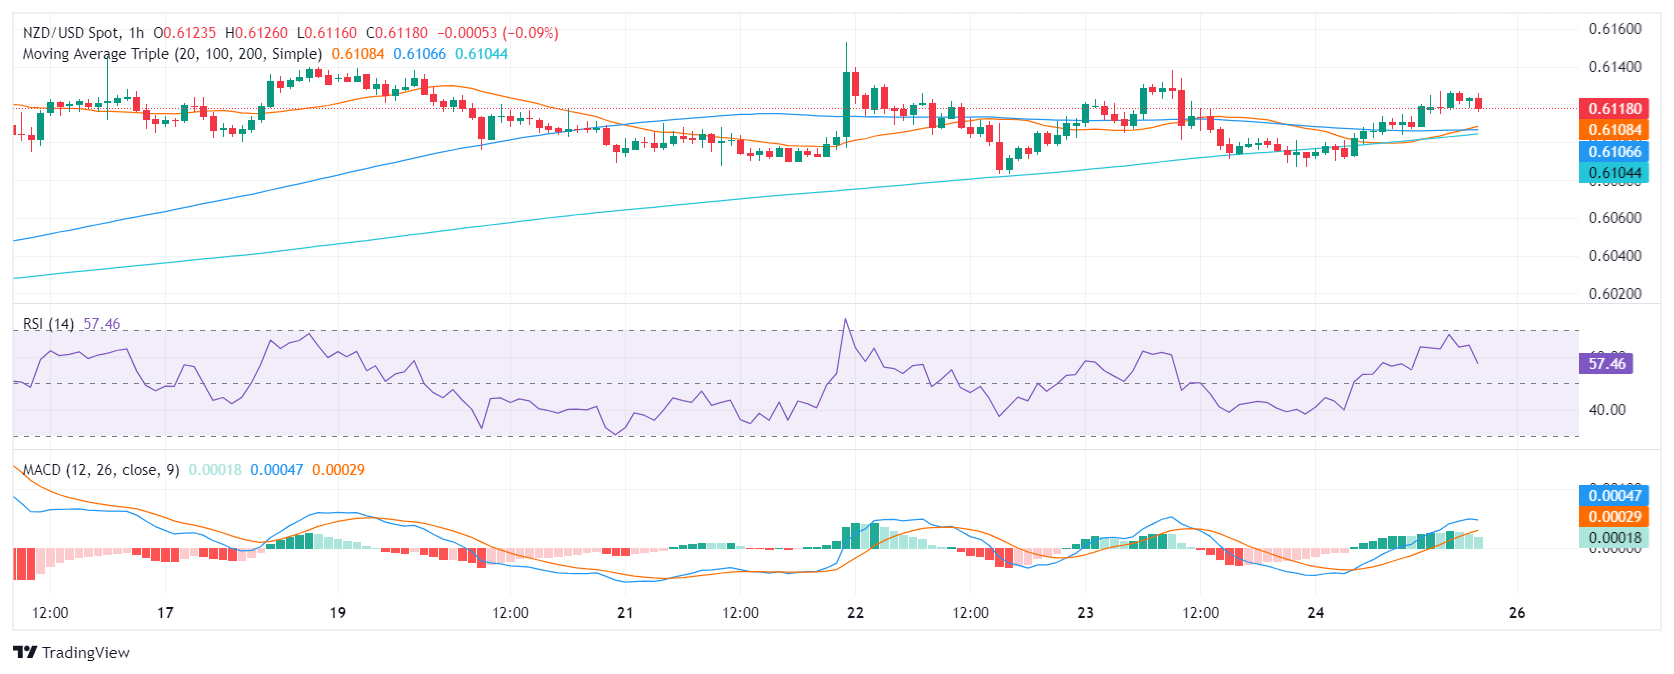
  • The hourly charts reveal a temporary dip in the RSI and a MACD flattening, signaling a possible short-term consolidation.
  • Pending bullish crossover between the 200 and 100-day SMA at 0.6040 could bolster the bullish momentum in future sessions.

During Friday's session, NZD/USD rose towards the 0.6125 level. The positive trajectory of the pair continues to convey a strong buyer influence in the market. However, echoes of consolidation may suggest a breather following the recent surge which pushed the pair above the 100 and 200-day Simple Moving Averages (SMA).

Examining the daily chart of the NZD/ pair, it is apparent that the Relative Strength Index (RSI) reveals a robust positive trend. After a close approach to overbought conditions at 69, the RSI receded to a still positive level of 63. In line with that, the Moving Average Convergence Divergence (MACD) prints flat green bars which may suggest a flattening momentum.

NZD/USD daily chart
Transitioning to the hourly chart, there is a discernible decreasing trend in the RSI readings, with figures retreating from 64 to 57 throughout Friday’s session. The MACD histogram aligns with this pattern, with flat green bars that signal reduced upward momentum.

NZD/USD hourly chart
From a broader perspective, the position of NZD/USD suggests a strong bullish trend. Trading above the Simple Moving Averages (SMA) of 20, 100, and 200-day, the pair displays upward momentum both on short-term and long-term scales.

Incorporating both the daily and hourly RSI trends, along with MACD and SMA positioning, the conclusion is drawn that the NZD/USD may need some respite after its recent surge. Despite this, the market structure maintains its bullish tone.


NZD/USD

Overview
Today last price 0.6118
Today Daily Change 0.0019
Today Daily Change % 0.31
Today daily open 0.6099
 
Trends
Daily SMA20 0.603
Daily SMA50 0.6003
Daily SMA100 0.6071
Daily SMA200 0.6042
 
Levels
Previous Daily High 0.6138
Previous Daily Low 0.6091
Previous Weekly High 0.6146
Previous Weekly Low 0.5995
Previous Monthly High 0.6079
Previous Monthly Low 0.5851
Daily Fibonacci 38.2% 0.612
Daily Fibonacci 61.8% 0.6109
Daily Pivot Point S1 0.6081
Daily Pivot Point S2 0.6062
Daily Pivot Point S3 0.6033
Daily Pivot Point R1 0.6128
Daily Pivot Point R2 0.6157
Daily Pivot Point R3 0.6175


Haftungsausschluss: Nur zu Informationszwecken. Die bisherige Performance ist kein verlässlicher Indikator für zukünftige Ergebnisse.
placeholder
Japanischer Yen wertet auf, da Händler auf eine weitere Zinserhöhung der BoJ setzenDer japanische Yen (JPY) machte am Donnerstag jüngste Verluste wett, angeregt durch Kommentare des Mitglieds des Vorstands der Bank of Japan (BoJ), Seiji Adachi, am Mittwoch.
Autor  FXStreet
Do. 30.Mai
Der japanische Yen (JPY) machte am Donnerstag jüngste Verluste wett, angeregt durch Kommentare des Mitglieds des Vorstands der Bank of Japan (BoJ), Seiji Adachi, am Mittwoch.
placeholder
Saudi-Drohung stoppt EU-Pläne zur Enteignung RusslandsInvesting.com – Mit dem Beginn des russischen Angriffskriegs auf die Ukraine froren die EU und die USA russische Vermögenswerte im Umfang von 300 Milliarden Dollar ein. Zwischenzeitlich kam die Idee a
Autor  Investing.com
Mi. 10.Jul
Investing.com – Mit dem Beginn des russischen Angriffskriegs auf die Ukraine froren die EU und die USA russische Vermögenswerte im Umfang von 300 Milliarden Dollar ein. Zwischenzeitlich kam die Idee a
placeholder
Ist der Ethereum-ETF erfolgreich gestartet?Der Start des Ethereum-ETFs war ein voller Erfolg. Sie konnten sogar am ersten Handelstag den Rekord des Bitcoin-Fonds brechen. Erfahren Sie mehr über den Handel des Ethereum-ETFs und welche Ethereum-ETFs besonders beliebt sind.
Autor  Mitrade Team
vor 19 Stunden
Der Start des Ethereum-ETFs war ein voller Erfolg. Sie konnten sogar am ersten Handelstag den Rekord des Bitcoin-Fonds brechen. Erfahren Sie mehr über den Handel des Ethereum-ETFs und welche Ethereum-ETFs besonders beliebt sind.
placeholder
Wöchentliche Bitcoin-Prognose: Wird BTC sich von den jüngsten Turbulenzen am Markt erholen können?Bitcoin (BTC) erholte sich am Freitag auf 67.000 USD, nachdem er am Vortag Unterstützung bei etwa 63.500 USD gefunden hatte.
Autor  FXStreet
vor 17 Stunden
Bitcoin (BTC) erholte sich am Freitag auf 67.000 USD, nachdem er am Vortag Unterstützung bei etwa 63.500 USD gefunden hatte.
placeholder
Bitcoin: Trump jagt nur Stimmen – BTC wird keine US-Reserve, sagt SchiffInvesting.com – Der ehemalige US-Präsident und Präsidentschaftskandidat Donald Trump hatte zuletzt immer wieder seine Unterstützung für Kryptowährungen, insbesondere Bitcoin, verkündet. Dies sorgte be
Autor  Investing.com
vor 16 Stunden
Investing.com – Der ehemalige US-Präsident und Präsidentschaftskandidat Donald Trump hatte zuletzt immer wieder seine Unterstützung für Kryptowährungen, insbesondere Bitcoin, verkündet. Dies sorgte be
verbundene Finanzinstrumente
goTop
quote