

EUR/GBP declines to 22-month low as pressure on Euro weighs

Quelle Fxstreet
  • EUR/GBP heads for 0.8400 as Euro gets forced lower by political turmoil.
  • Economic figures from the EU continue to disappoint.
  • A rate cut from the ECB has widened the rate differential.

EUR/GBP saw a sharp downside push on Thursday, driving the pair to a nearly two-year low near the 0.8400 handle as political and economic uncertainty weigh on the Euro (EUR). Economic data has broadly missed forecasts in both the UK and the European economic zone, but a recent rate cut from the European Central Bank (ECB) has widened the Euro’s rate differential against other major currencies.

Pan-European Industrial Production contracted -0.1% MoM in April, missing the forecast 0.2% and the previous month was revised to 0.5% from 0.6%. YoY Industrial Production alos declined by a steeper-than-expected -3.0% compared to the forecast -1.9% and the previous period’s revised -1.2%.

European Parliamentary elections swung in favor of center-right and right-leaning parties across the European Union, sparking uncertainty in European financial markets. France has been driven to snap elections that could see President Emmanuel Macron get unseated by Deputy of the French National Assembly (FSA) Marine Le Pen. Le Pen’s political rise is shaking stability in financial markets as the FNA’s platform of steep tax cuts and lowering of the retirement age threatens to introduce financial instability in echoes of Lizz Truss’s brief stint as the Prime Minister of the UK.

UK data remains limited this week, leaving GBP traders to wait for next week’s latest UK Consumer Price Index (CPI) inflation print. The Bank of England (BoE) also delivers its latest rate call later next week. The BoE last voted 7-to-2 to keep interest rates on hold at 5.25%.

EUR/GBP technical outlook

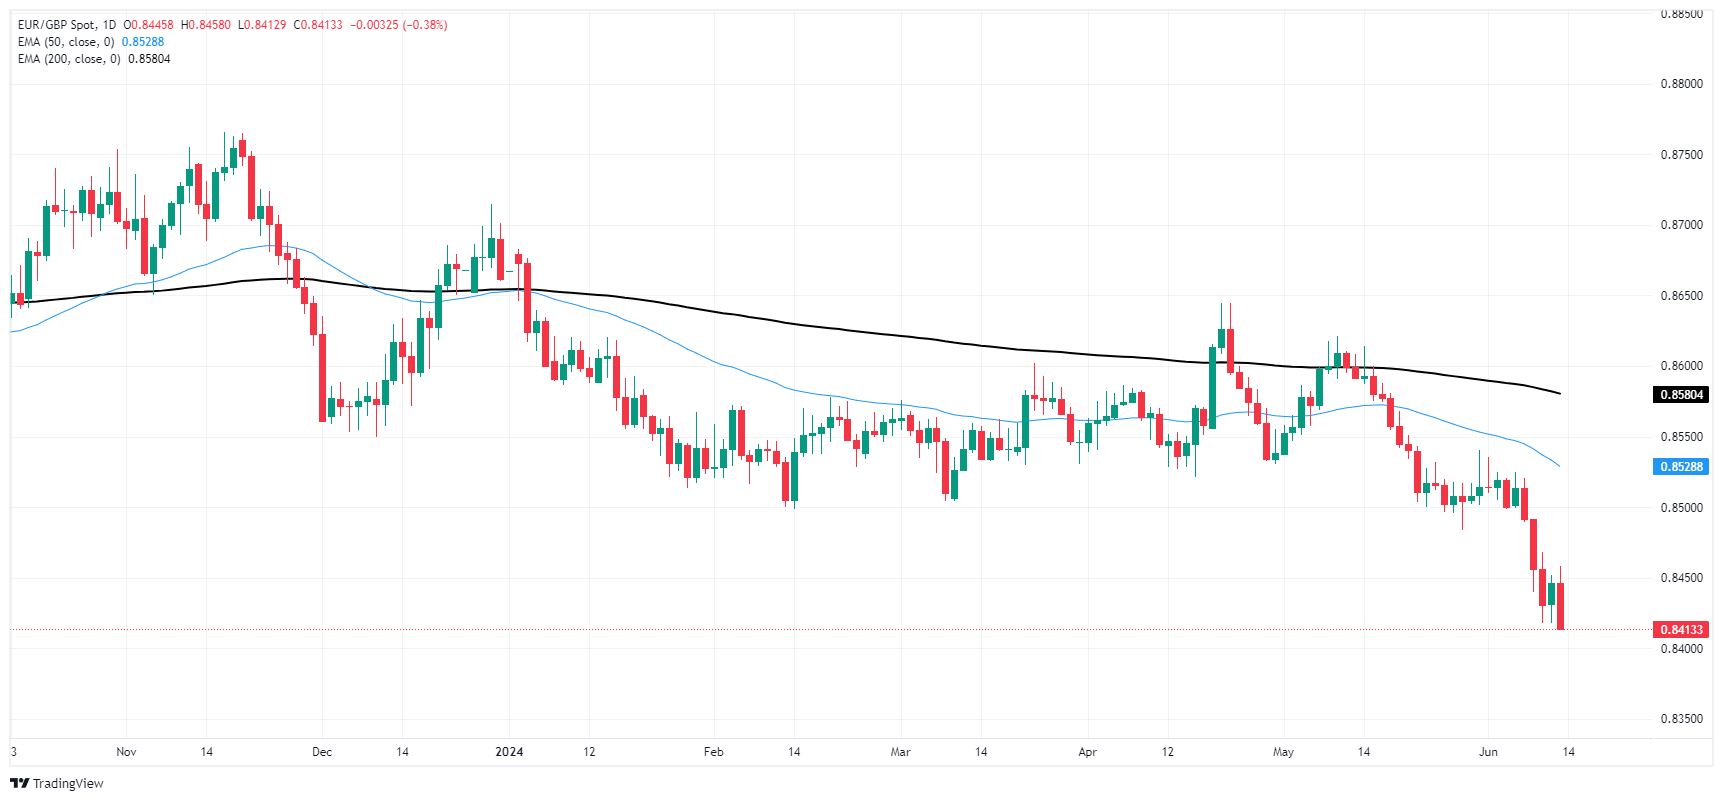
EUR/GBP’s backslide on Thursday marks a fresh 22-month low for the pair, sending bids tumbling towards the 0.8400 handle. Bearish flows have dragged the pair into further declines after the EUR/GBP through technical support at 0.8500, and bulls are having a difficult time hitting the brakes.

EUR/GBP is accelerating towards the downside away from the 200-day Exponential Moving Average (EMA) at 0.8581. The pair is down 3% from 2024’s opening bids, and major resistance is priced in even further down at 0.8300.

EUR/GBP daily chart
EUR/GBP

Overview
Today last price 0.8414
Today Daily Change -0.0032
Today Daily Change % -0.38
Today daily open 0.8446
 
Trends
Daily SMA20 0.8508
Daily SMA50 0.8548
Daily SMA100 0.8548
Daily SMA200 0.8599
 
Levels
Previous Daily High 0.8452
Previous Daily Low 0.8418
Previous Weekly High 0.8536
Previous Weekly Low 0.8489
Previous Monthly High 0.8621
Previous Monthly Low 0.8484
Daily Fibonacci 38.2% 0.8439
Daily Fibonacci 61.8% 0.8431
Daily Pivot Point S1 0.8425
Daily Pivot Point S2 0.8405
Daily Pivot Point S3 0.8392
Daily Pivot Point R1 0.8459
Daily Pivot Point R2 0.8472
Daily Pivot Point R3 0.8493


Haftungsausschluss: Nur zu Informationszwecken. Die bisherige Performance ist kein verlässlicher Indikator für zukünftige Ergebnisse.
placeholder
Silberpreis-Prognose: XAG/USD fällt aufgrund hawkischer Fed-Stimmung auf nahe 58,00 US-DollarDer Silberpreis (XAG/USD) gibt nach zwei Tagen mit Gewinnen nach und notiert am Freitag während der frühen europäischen Handelsstunden bei rund 58,10 USD je Feinunze. Das zinslose weiße Metall steht angesichts der Erwartungen an eine straffere Geldpolitik der Federal Reserve (Fed) vor deutlichen Herausforderungen
Autor  FXStreet
Fr. 31.Jul
Der Silberpreis (XAG/USD) gibt nach zwei Tagen mit Gewinnen nach und notiert am Freitag während der frühen europäischen Handelsstunden bei rund 58,10 USD je Feinunze. Das zinslose weiße Metall steht angesichts der Erwartungen an eine straffere Geldpolitik der Federal Reserve (Fed) vor deutlichen Herausforderungen
placeholder
Goldpreis-Beben voraus? Der Chart sendet ein WarnsignalDer Goldpreis steht an einer Marke, die Anleger nicht ignorieren sollten. Im Tageschart liegen die Gold-Futures aktuell bei 4.043,30 USD. Auf den ersten Blick wirkt das noch relativ stabil. Doch der Chart erzählt eine andere Geschichte.
Autor  FXStreet
Do. 30.Jul
Der Goldpreis steht an einer Marke, die Anleger nicht ignorieren sollten. Im Tageschart liegen die Gold-Futures aktuell bei 4.043,30 USD. Auf den ersten Blick wirkt das noch relativ stabil. Doch der Chart erzählt eine andere Geschichte.
placeholder
WTI-Preisprognose: Wahrscheinliche erneute Erreichung des 50-Tage-Hochs über 92 $ bei erneuten US-Iran-AngriffenWest Texas Intermediate (WTI), Futures an der NYMEX, notieren am Mittwoch im frühen europäischen Handel 3,2 % höher bei rund 81,00 USD.
Autor  FXStreet
Mi. 29.Jul
West Texas Intermediate (WTI), Futures an der NYMEX, notieren am Mittwoch im frühen europäischen Handel 3,2 % höher bei rund 81,00 USD.
placeholder
Kryptowährungen brechen ein, da der Senat den CLARITY Act verzögert; Bitcoin fällt unter 65.000 $TradingKey – Der CLARITY Act hat in Verbindung mit dem wachsenden Druck für eine Zinserhöhung der US-Notenbank Federal Reserve einen kollektiven Einbruch bei Kryptowährungen ausgelöst.Am 28. Juli erle
Autor  Mitrade Team
Di. 28.Jul
TradingKey – Der CLARITY Act hat in Verbindung mit dem wachsenden Druck für eine Zinserhöhung der US-Notenbank Federal Reserve einen kollektiven Einbruch bei Kryptowährungen ausgelöst.Am 28. Juli erle
placeholder
WTI fällt auf nahezu 82,50 $ da die USA und der Iran Angriffe für mögliche Diplomatie pausierenDer Preis für West Texas Intermediate (WTI) eröffnete mit einer bärischen Kurslücke und fiel um über 7%, wobei er während der asiatischen Handelsstunden am Montag bei rund 82,50 $ pro Barrel gehandelt wurde. Die Rohölpreise gaben nach, nachdem die Vereinigten Staaten (US) und der Iran ihre Angriffe über das Wochenende ausgesetzt hatten, nach zwei Wochen direkter Angriffe.
Autor  FXStreet
Mo. 27.Jul
Der Preis für West Texas Intermediate (WTI) eröffnete mit einer bärischen Kurslücke und fiel um über 7%, wobei er während der asiatischen Handelsstunden am Montag bei rund 82,50 $ pro Barrel gehandelt wurde. Die Rohölpreise gaben nach, nachdem die Vereinigten Staaten (US) und der Iran ihre Angriffe über das Wochenende ausgesetzt hatten, nach zwei Wochen direkter Angriffe.
verbundene Finanzinstrumente
goTop
quote