GBP/JPY Price Analysis: Bulls maintain stronghold, despite profit take-off

Quelle Fxstreet
  • The daily chart shows that the bulls are taking their foot off the gas and started to take profits.
  • The hourly chart shows signs of short-term selling pressure ahead of the Asian session.
  • The main support to hold is the 20-day SMA at 196.00.

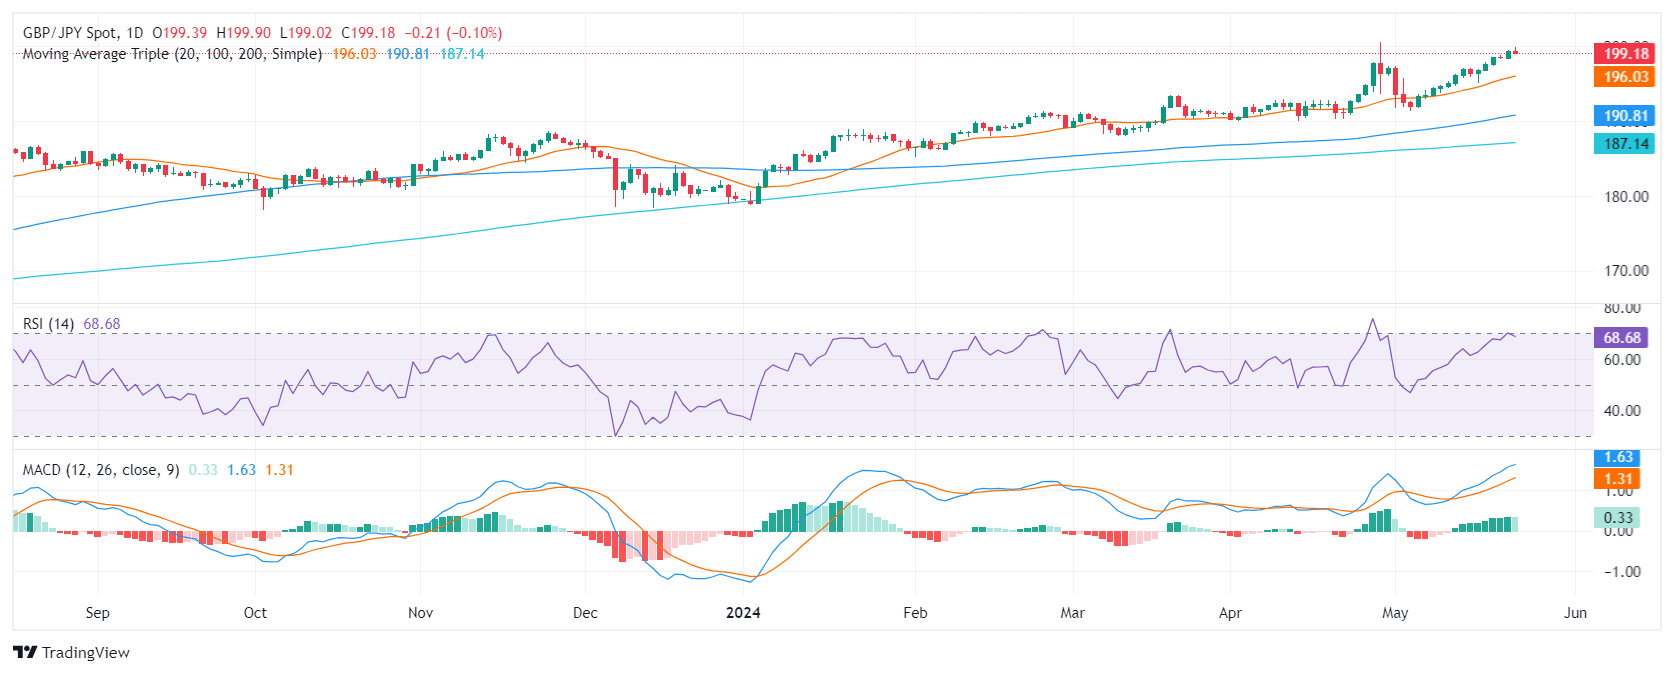
On Thursday's session, the GBP/JPY declined to 199.20 but holds an overall positive outlook. This theory is backed up by the pair approaching near-cycle highs. If the cross holds the 20-day Simple Moving Average (SMA) at 196.00, the downward movements could be considered corrective.

In the daily chart, the Relative Strength Index (RSI) exhibits heightened bullish momentum as it comfortably resides in positive territory nearing overbought conditions but seems to be flattening. Simultaneously, the Moving Average Convergence Divergence (MACD) reveals a decreasing bullish momentum, distinguished by falling green bars. This indicates that while buyers currently hold the reins, their influence may be abating.

GBP/JPY daily chart

Switching to the hourly chart, the RSI portrays a contrasting bearish tendency, with the latest reading of approximately 44, dipping into negative territory. A declining trend is corroborated by the MACD's ascending red bars, suggesting a surge in negative momentum as sellers gain influence in the short term.

GBP/JPY hourly chart

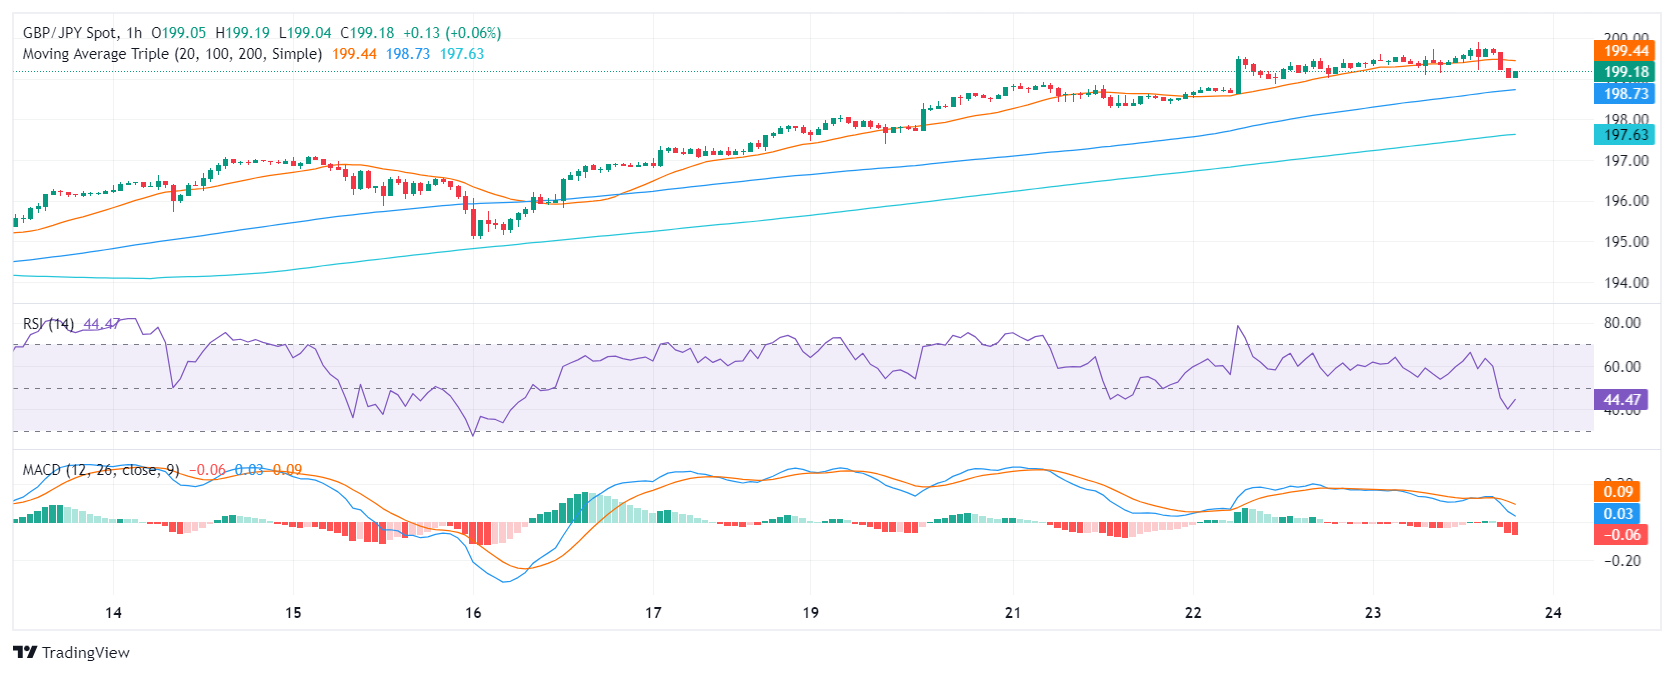
To conclude, the GBP/JPY pair rose near cycle highs, and indicators reached overbought conditions which may trigger a corrective phase. Ahead of the Asian session, investors are taking profits, evident in the hourly chart where indicators are in the red. However, as long as the pair holds above the 20,100 and 200-day SMAs, the outlook will be bullish.


GBP/JPY

Overview
Today last price 199.17
Today Daily Change -0.22
Today Daily Change % -0.11
Today daily open 199.39
 
Trends
Daily SMA20 195.81
Daily SMA50 193.25
Daily SMA100 190.65
Daily SMA200 187.07
 
Levels
Previous Daily High 199.54
Previous Daily Low 198.38
Previous Weekly High 197.86
Previous Weekly Low 194.74
Previous Monthly High 200.59
Previous Monthly Low 190
Daily Fibonacci 38.2% 199.1
Daily Fibonacci 61.8% 198.83
Daily Pivot Point S1 198.66
Daily Pivot Point S2 197.94
Daily Pivot Point S3 197.5
Daily Pivot Point R1 199.83
Daily Pivot Point R2 200.27
Daily Pivot Point R3 200.99


Haftungsausschluss: Nur zu Informationszwecken. Die bisherige Performance ist kein verlässlicher Indikator für zukünftige Ergebnisse.
placeholder
XRP-Beben bei Ripple: Kommt der nächste Kursrutsch?Ripple (XRP) kämpft am Mittwoch sichtbar mit Gegenwind. Der Kurs steht unter Druck, doch eine Linie hält bislang stand: die unmittelbare Unterstützung bei 1,40 US-Dollar. Genau dort stabilisiert sich der Preis zum Zeitpunkt der Erstellung.
Autor  FXStreet
Mi. 11.Feb
Ripple (XRP) kämpft am Mittwoch sichtbar mit Gegenwind. Der Kurs steht unter Druck, doch eine Linie hält bislang stand: die unmittelbare Unterstützung bei 1,40 US-Dollar. Genau dort stabilisiert sich der Preis zum Zeitpunkt der Erstellung.
placeholder
Silberpreis unter Druck: Die 38,2-Prozent-Hürde bleibt unüberwindbarXAG/USD fällt auf 82 Dollar. Scheitern am 38,2% Fibonacci-Level und SMA-Widerstand belasten. Wichtige Unterstützungen im Fokus.
Autor  Mitrade Team
Do. 12.Feb
XAG/USD fällt auf 82 Dollar. Scheitern am 38,2% Fibonacci-Level und SMA-Widerstand belasten. Wichtige Unterstützungen im Fokus.
placeholder
Goldpreis im Rückwärtsgang: US-Jobwunder lässt Zinshoffnungen für März schwindenXAU/USD fällt auf 5.050 Dollar. Starke US-Jobdaten (130k Stellen) dämpfen Zinshoffnung für März. Wichtige Chartmarken bei 5.144 und 4.757 Dollar.
Autor  Mitrade Team
Do. 12.Feb
XAU/USD fällt auf 5.050 Dollar. Starke US-Jobdaten (130k Stellen) dämpfen Zinshoffnung für März. Wichtige Chartmarken bei 5.144 und 4.757 Dollar.
placeholder
Cardano-Analyse: Derivate-Markt sendet Hoffnungssignale – Gelingt die Trendwende?Positive Funding Rates und steigende Long-Wetten deuten auf Erholung hin. Charttechnik zeigt überverkaufte Signale bei 0,257 Dollar, Widerstand bei 0,301 Dollar im Fokus.
Autor  Mitrade Team
Do. 12.Feb
Positive Funding Rates und steigende Long-Wetten deuten auf Erholung hin. Charttechnik zeigt überverkaufte Signale bei 0,257 Dollar, Widerstand bei 0,301 Dollar im Fokus.
placeholder
Silberpreis-Prognose: XAG/USD steigt auf fast 76,50 US-Dollar, hat jedoch die dritte wöchentliche Abnahme im BlickDer Silberpreis (XAG/USD) gewinnt an Boden, nachdem er im vorherigen Handel einen Verlust von 11,5 % verzeichnete, und notiert in den frühen europäischen Stunden am Freitag um die 76,60 USD je Feinunze. Der Silberpreis steht jedoch vor einem dritten wöchentlichen Rückgang in Folge, da die Volatilität wieder auftritt.
Autor  FXStreet
Fr. 13.Feb
Der Silberpreis (XAG/USD) gewinnt an Boden, nachdem er im vorherigen Handel einen Verlust von 11,5 % verzeichnete, und notiert in den frühen europäischen Stunden am Freitag um die 76,60 USD je Feinunze. Der Silberpreis steht jedoch vor einem dritten wöchentlichen Rückgang in Folge, da die Volatilität wieder auftritt.
verbundene Finanzinstrumente
goTop
quote