NZD/USD Price Analysis: Bears hold sway, subtle signs of potential bullish reversal emerging

Quelle Fxstreet
  • Diminishing red bars of the daily MACD imply a potential easing of bearish momentum, signaling an early indication of a bullish turnaround.
  • The hourly chart reveals an RSI oscillating in the positive zone, and MACD with green bars, signaling potential short-term positive momentum.

The NZD/USD pair advanced to 0.5920 on Monday, reflecting a gain of 0.47%. Overall, the bearish force remains strong, while the bulls begin to give signs of potential recovery, highlighting the start of a possible bullish reversal.

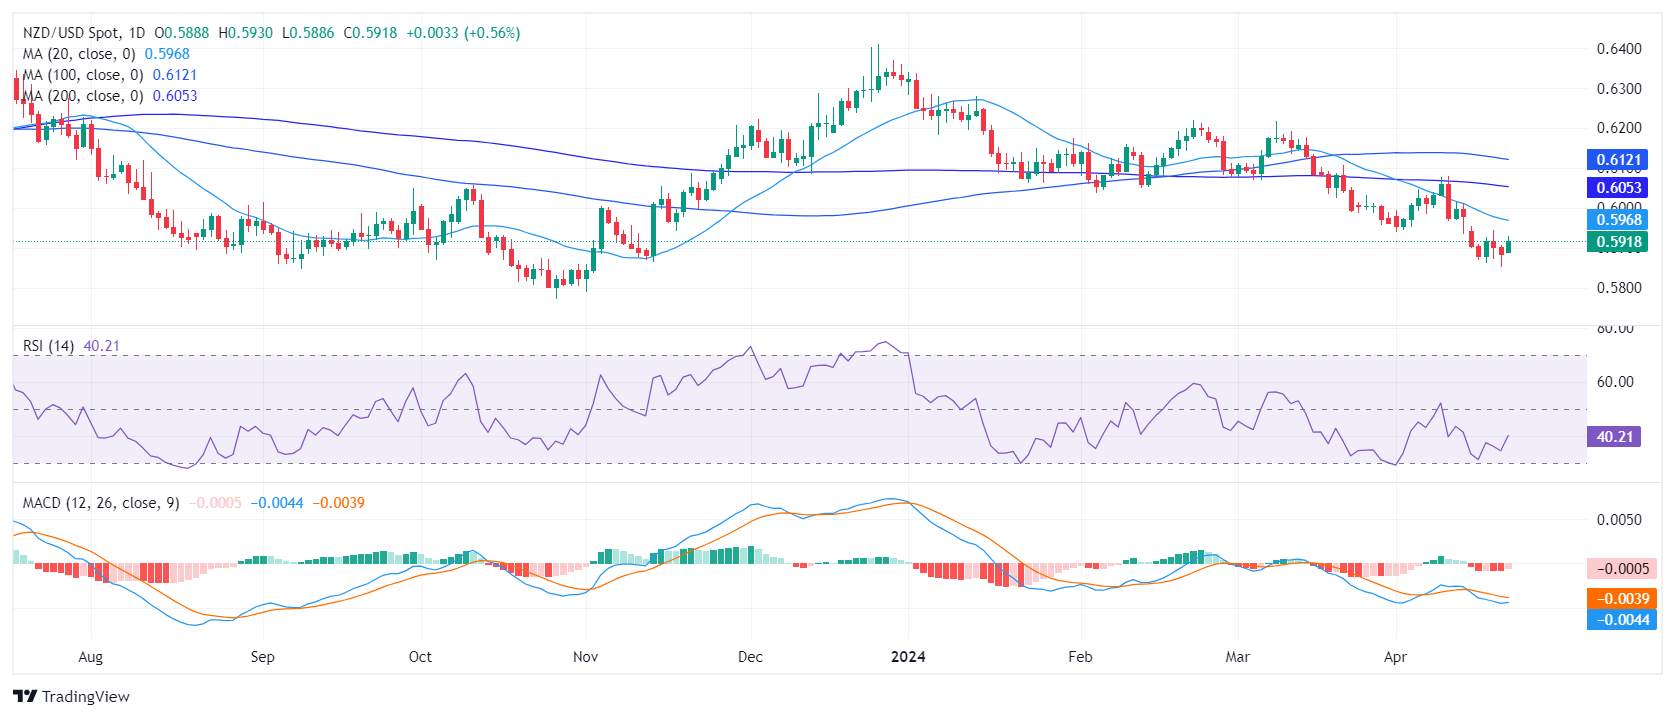
On the daily chart, the Relative Strength Index (RSI) remains in negative territory, indicating an ongoing bearish momentum. Although there is a minor upward trend, it remains short of breaking into the positive zone. The decreasing red bars of the Moving Average Convergence Divergence (MACD) suggest a slide in negative momentum, indicating possible signs of a potential bullish reversal.

NZD/USD daily chart

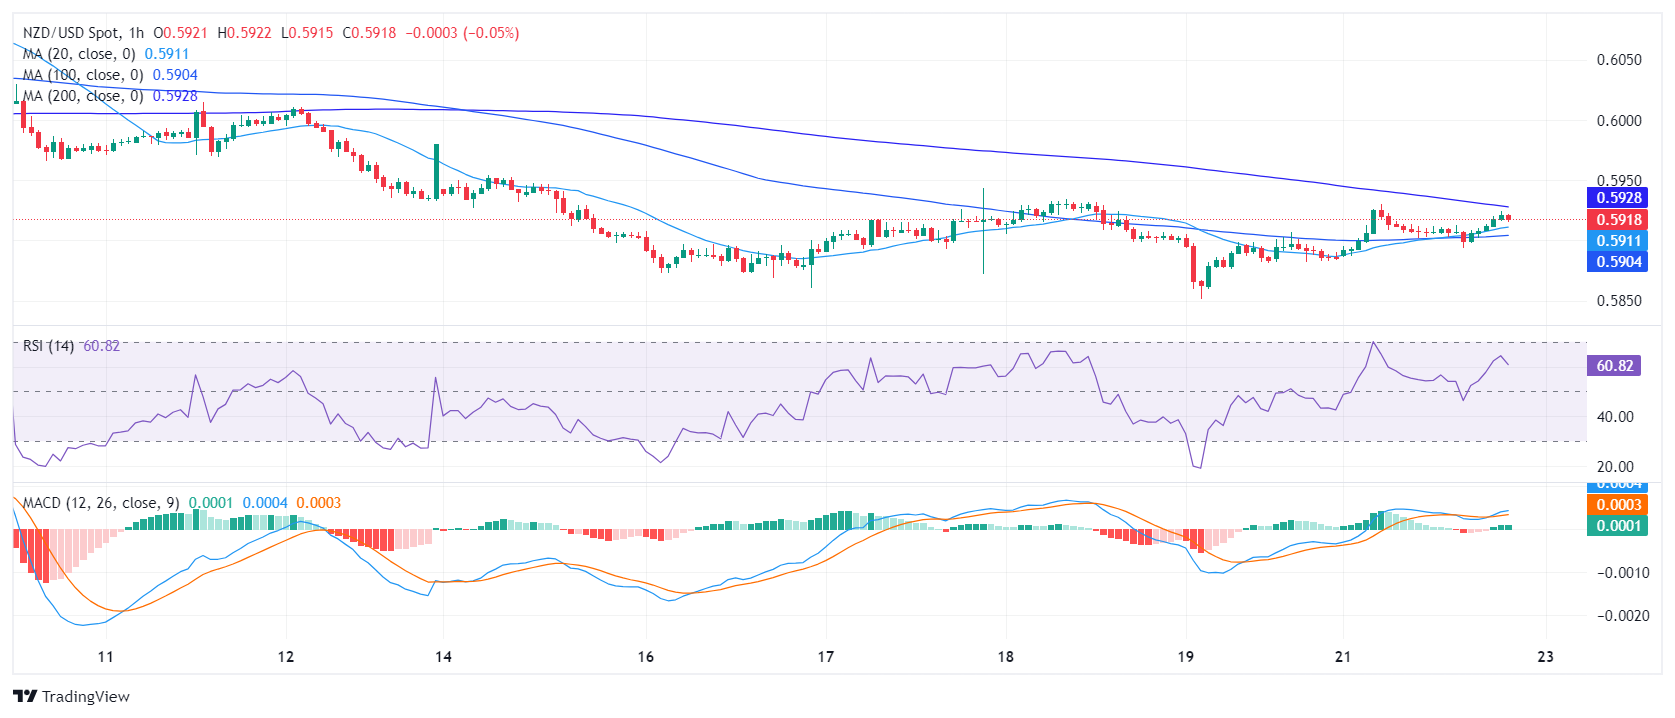
On the hourly chart, a similar condition prevails. The RSI has been oscillating in the positive territory for most of the session, but recently recorded a slight downward inclination, signaling a potential pullback. The MACD histogram also shows rising green bars, indicating a surge in positive momentum.

NZD/USD hourly chart

The broader market perspective reveals much regarding the NZD/USD's performance versus its Simple Moving Average (SMA). With the pair being below the 20,100 and 200-day SMA, a long and short-term downward pressure on the currency is evident.

In summary, there is a bearish dominance in the market, reinforced by both the RSI and MACD trends on the daily and hourly charts, as well as the SMA positioning. However, the slight increase in the daily RSI and the diminishing bearish momentum in the MACD could signify the early stages of a market reversal.


NZD/USD

Overview
Today last price 0.5919
Today Daily Change 0.0034
Today Daily Change % 0.58
Today daily open 0.5885
 
Trends
Daily SMA20 0.5973
Daily SMA50 0.6062
Daily SMA100 0.6123
Daily SMA200 0.6055
 
Levels
Previous Daily High 0.5907
Previous Daily Low 0.5851
Previous Weekly High 0.5954
Previous Weekly Low 0.5851
Previous Monthly High 0.6218
Previous Monthly Low 0.5956
Daily Fibonacci 38.2% 0.5873
Daily Fibonacci 61.8% 0.5886
Daily Pivot Point S1 0.5855
Daily Pivot Point S2 0.5825
Daily Pivot Point S3 0.5799
Daily Pivot Point R1 0.5911
Daily Pivot Point R2 0.5937
Daily Pivot Point R3 0.5967


Haftungsausschluss: Nur zu Informationszwecken. Die bisherige Performance ist kein verlässlicher Indikator für zukünftige Ergebnisse.
placeholder
Top 10 Krypto-Prognosen für 2026: Institutionelle Nachfrage und Großbanken könnten Bitcoin Rückenwind gebenFür 2026 rücken institutionelle Nachfrage, ETF-Flows (über $700 million Abflüsse im Dezember), BTC-Reserve-Asset-Thesen (3.74 million BTC bei 251 Entities) und zehn Marktprognosen in den Fokus – inklusive eines möglichen Bitcoin-Ziels von $140,259 bei bullischem Ausbruch.
Autor  Mitrade Team
22.Dez. 2025
Für 2026 rücken institutionelle Nachfrage, ETF-Flows (über $700 million Abflüsse im Dezember), BTC-Reserve-Asset-Thesen (3.74 million BTC bei 251 Entities) und zehn Marktprognosen in den Fokus – inklusive eines möglichen Bitcoin-Ziels von $140,259 bei bullischem Ausbruch.
placeholder
XRP-Beben: Warum Ripple 2026 böse überraschen könnteWas ist da bei Ripple los? XRP rutscht bereits den dritten Tag in Folge ab – und plötzlich ist die Euphorie der Jahresanfangsrally wie weggeblasen. Noch am Dienstag jubelten Anleger über Kurse von 2,41 US-Dollar, dem höchsten Stand seit dem 14. November.
Autor  FXStreet
Fr. 09.Jan
Was ist da bei Ripple los? XRP rutscht bereits den dritten Tag in Folge ab – und plötzlich ist die Euphorie der Jahresanfangsrally wie weggeblasen. Noch am Dienstag jubelten Anleger über Kurse von 2,41 US-Dollar, dem höchsten Stand seit dem 14. November.
placeholder
Top-Krypto-Gewinner: Monero nähert sich Rekordhoch von $600, Story und Render setzen Gewinne fortMonero nähert sich Rekordhoch von $600, Story setzt Erholung mit Ziel $3 fort und Render handelt nahe 200-Tage-EMA bei $2.71 – starkes bullisches Momentum bleibt bestehen.
Autor  Mitrade Team
vor 6 Stunden
Monero nähert sich Rekordhoch von $600, Story setzt Erholung mit Ziel $3 fort und Render handelt nahe 200-Tage-EMA bei $2.71 – starkes bullisches Momentum bleibt bestehen.
placeholder
Gold gibt nach Rekordhoch leicht nach – bullischer Grundton bleibt dank Geopolitik und Fed-SorgenGold (XAU/USD) markiert nahe $4,600 ein Rekordhoch, bleibt durch geopolitische Risiken und Fed-Unabhängigkeitsdebatte gestützt; vor US-Inflationsdaten mögliches Abflachen, Support bei $4,365 sowie $4,325–4,320, RSI 71.82.
Autor  Mitrade Team
vor 4 Stunden
Gold (XAU/USD) markiert nahe $4,600 ein Rekordhoch, bleibt durch geopolitische Risiken und Fed-Unabhängigkeitsdebatte gestützt; vor US-Inflationsdaten mögliches Abflachen, Support bei $4,365 sowie $4,325–4,320, RSI 71.82.
placeholder
Solana-Ausblick: SOL dreht an der 50-Tage-EMA nach oben – ETF-Zuflüsse stabil, Privacy-Hackathon als neuer ImpulsSolana (SOL) steigt am Montag knapp 2% und erholt sich von der 50-Tage-EMA ($136). US-Spot-SOL-ETFs melden $41.08 million Wochenzuflüsse, Derivate-OI bei $8.58 billion (+4.90%). Privacy-Hackathon startet mit $75,000 Rewards; technisch rücken $145, $150 und $159 in den Fokus.
Autor  Mitrade Team
vor 4 Stunden
Solana (SOL) steigt am Montag knapp 2% und erholt sich von der 50-Tage-EMA ($136). US-Spot-SOL-ETFs melden $41.08 million Wochenzuflüsse, Derivate-OI bei $8.58 billion (+4.90%). Privacy-Hackathon startet mit $75,000 Rewards; technisch rücken $145, $150 und $159 in den Fokus.
verbundene Finanzinstrumente
goTop
quote