AUD/JPY Price Analysis: Climbs as buyers regain control, target 100.00

Quelle Fxstreet
  • AUD/JPY climbs sharply, approaching the key psychological level of 100.00, buoyed by renewed optimism in global markets.
  • Technical analysis highlights potential resistance at the year-to-date high of 100.81, with further targets at 101.00.
  • Key support levels identified at 99.65 and 99.20, with potential downside risk to the March 28 low at 98.17.

The AUD/JPY rallies sharply amid a risk-on impulse as Wall Street resumes its rally amid a light economic docket. At the time of writing, the cross-pair trades at 99.87 clocks gains of more than 0.60%.

AUD/JPY Price Analysis: Technical outlook

The AUD/JPY witnessed the formation of a ‘hammer’ on Friday in the daily chart, suggesting that further upside is seen. However, the pair plunged sharply toward a one-month low of 97.78 last Friday on geopolitical risks. As tensions abated, the Aussie Dollar (AUD) gained traction against the Japanese Yen (JPY).

If AUD/JPY continues its rally towards 100.00, it could potentially test the current year-to-date (YTD) high at 100.81. Once this level is cleared, the next significant resistance would be at 101.00, providing clear targets for traders to considers.

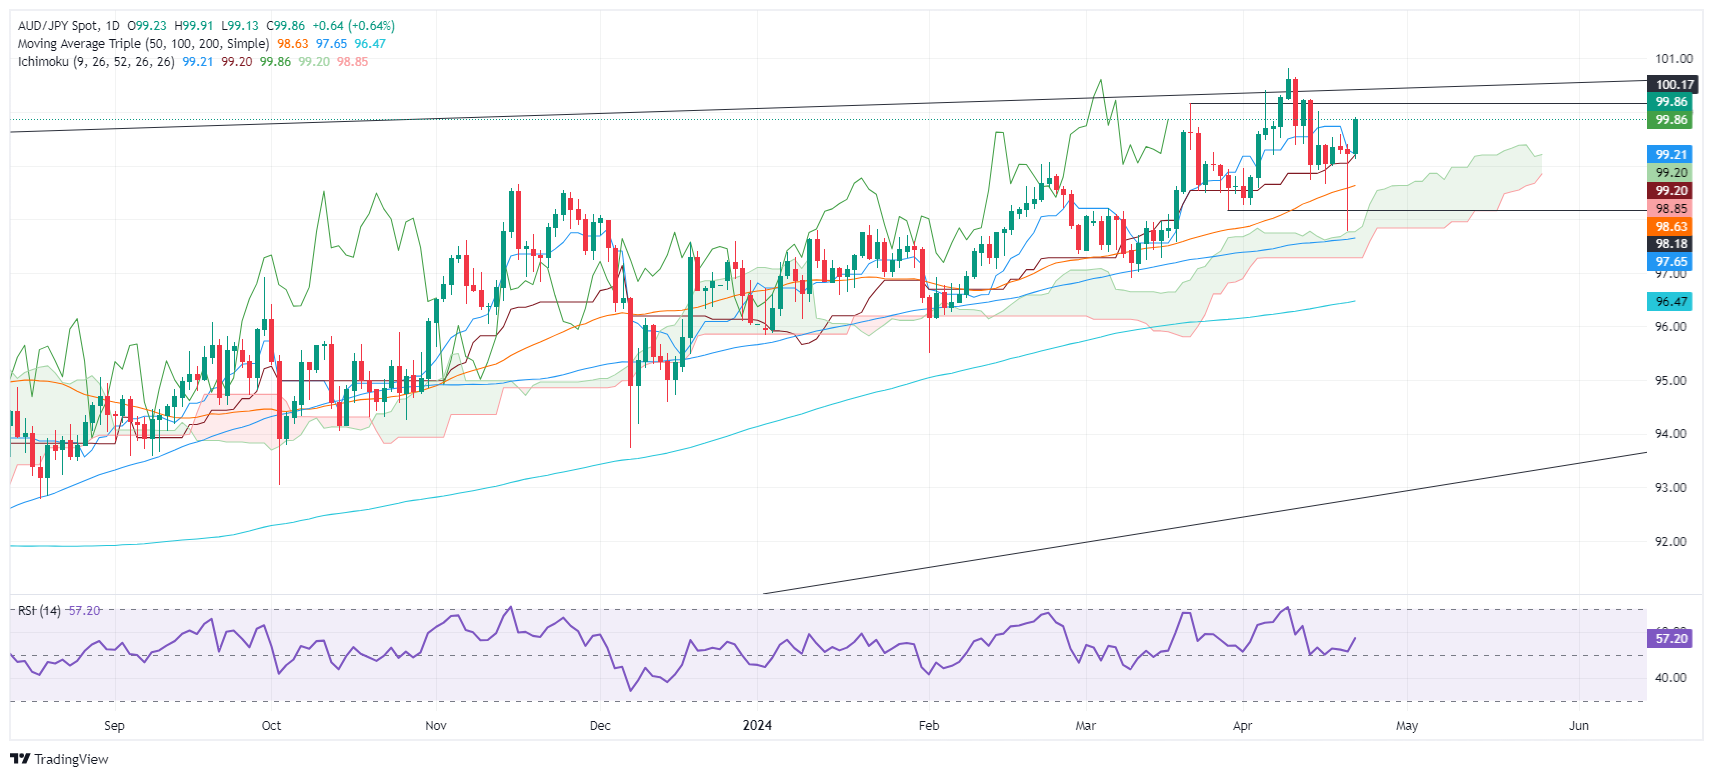
On the other hand, the AUD/JPY first support would be the 61.8% Fibo retracement at 99.65. Once cleared, the pair could drop toward the Tenkan-Sen and the Senkou Span A confluence at 99.20, followed by the 99.00 mark. Once surpassed, the next stop would be the March 28 swing low of 98.17.

AUD/JPY Price Action – Daily Chart

AUD/JPY

Overview
Today last price 99.87
Today Daily Change 0.65
Today Daily Change % 0.66
Today daily open 99.22
 
Trends
Daily SMA20 99.32
Daily SMA50 98.58
Daily SMA100 97.63
Daily SMA200 96.45
 
Levels
Previous Daily High 99.41
Previous Daily Low 97.78
Previous Weekly High 100.02
Previous Weekly Low 97.78
Previous Monthly High 100.17
Previous Monthly Low 96.9
Daily Fibonacci 38.2% 98.4
Daily Fibonacci 61.8% 98.78
Daily Pivot Point S1 98.2
Daily Pivot Point S2 97.18
Daily Pivot Point S3 96.57
Daily Pivot Point R1 99.83
Daily Pivot Point R2 100.43
Daily Pivot Point R3 101.46


Haftungsausschluss: Nur zu Informationszwecken. Die bisherige Performance ist kein verlässlicher Indikator für zukünftige Ergebnisse.
placeholder
Klimakiller KI: So plündern Big Techs unsere EnergiereservenInvesting.com – Der immense Stromverbrauch von Blockchains wie Bitcoin und Ethereum stand über viele Jahre hinweg im Fokus und wurde stets damit in Verbindung gebracht, wie umweltschädlich diese Techn
Autor  Investing.com
16.Jul. 2024
Investing.com – Der immense Stromverbrauch von Blockchains wie Bitcoin und Ethereum stand über viele Jahre hinweg im Fokus und wurde stets damit in Verbindung gebracht, wie umweltschädlich diese Techn
placeholder
Silberpreis-Prognose: XAG/USD handelt bei etwa 80,50 US-Dollar nach der Reduzierung jüngster VerlusteDer Silberpreis (XAG/USD) verringert seine täglichen Verluste, bleibt jedoch im negativen Bereich und handelt am Donnerstag in den frühen europäischen Stunden um die 80,50 USD je Feinunze.
Autor  FXStreet
Do. 05.Feb
Der Silberpreis (XAG/USD) verringert seine täglichen Verluste, bleibt jedoch im negativen Bereich und handelt am Donnerstag in den frühen europäischen Stunden um die 80,50 USD je Feinunze.
placeholder
Bitcoin trotzt Nahost-Krise: Kryptowährung schlägt Aktien und GoldBitcoin (BTC) hat sich in der vergangenen Woche trotz wachsender geopolitischer Spannungen weitgehend seitwärts bewegt. Am Dienstag legte die Kryptowährung um rund zwei Prozent zu und notierte bei etwa 69.987 US-Dollar.
Autor  FXStreet
Mi. 11.Mär
Bitcoin (BTC) hat sich in der vergangenen Woche trotz wachsender geopolitischer Spannungen weitgehend seitwärts bewegt. Am Dienstag legte die Kryptowährung um rund zwei Prozent zu und notierte bei etwa 69.987 US-Dollar.
placeholder
Gold gibt nach, da Inflationssorgen die US-Anleiherenditen und den USD steigen lassen; das Abwärtsrisiko bleibt abgefedertGold (XAU/USD) handelt am Donnerstag mit einer negativen Tendenz für den zweiten aufeinanderfolgenden Tag, obwohl es an weiterführendem Verkaufsdruck mangelt und der Intraday-Rückgang im Bereich von 5.125 Dollar zum Stillstand kommt
Autor  FXStreet
Do. 12.Mär
Gold (XAU/USD) handelt am Donnerstag mit einer negativen Tendenz für den zweiten aufeinanderfolgenden Tag, obwohl es an weiterführendem Verkaufsdruck mangelt und der Intraday-Rückgang im Bereich von 5.125 Dollar zum Stillstand kommt
placeholder
Gold erholt sich, da Zuflüsse in sichere Häfen inflationsbedingte Zinssorgen der Fed ausgleichenGold (XAU/USD) gewinnt am Freitag im asiatischen Handel an positiver Fahrt und erholt sich von einem Teil seiner Verluste, die in den vergangenen zwei Tagen verzeichnet wurden
Autor  FXStreet
vor 22 Stunden
Gold (XAU/USD) gewinnt am Freitag im asiatischen Handel an positiver Fahrt und erholt sich von einem Teil seiner Verluste, die in den vergangenen zwei Tagen verzeichnet wurden
verbundene Finanzinstrumente
goTop
quote