Dollar Index Price Forecast: DXY falling within channel

Quelle Fxstreet
  • The US Dollar Index has been trading in a rising channel for several months. 
  • After touching the top of the channel it reversed course and started to fall towards the lower channel line. 
  • Price is close to support and the RSI is oversold signaling a likely pause in the downmove. 

The US Dollar Index price (DXY) is declining within a multi-month long rising channel after touching the top borderline and rolling over. 

Given price tends to oscillate within a channel the Dollar Index is probably in the midst of a down-leg which means there is a good chance it could continue falling to the lower borderline before probably bouncing and resuming its trend higher.

Dollar Index 4-hour Chart

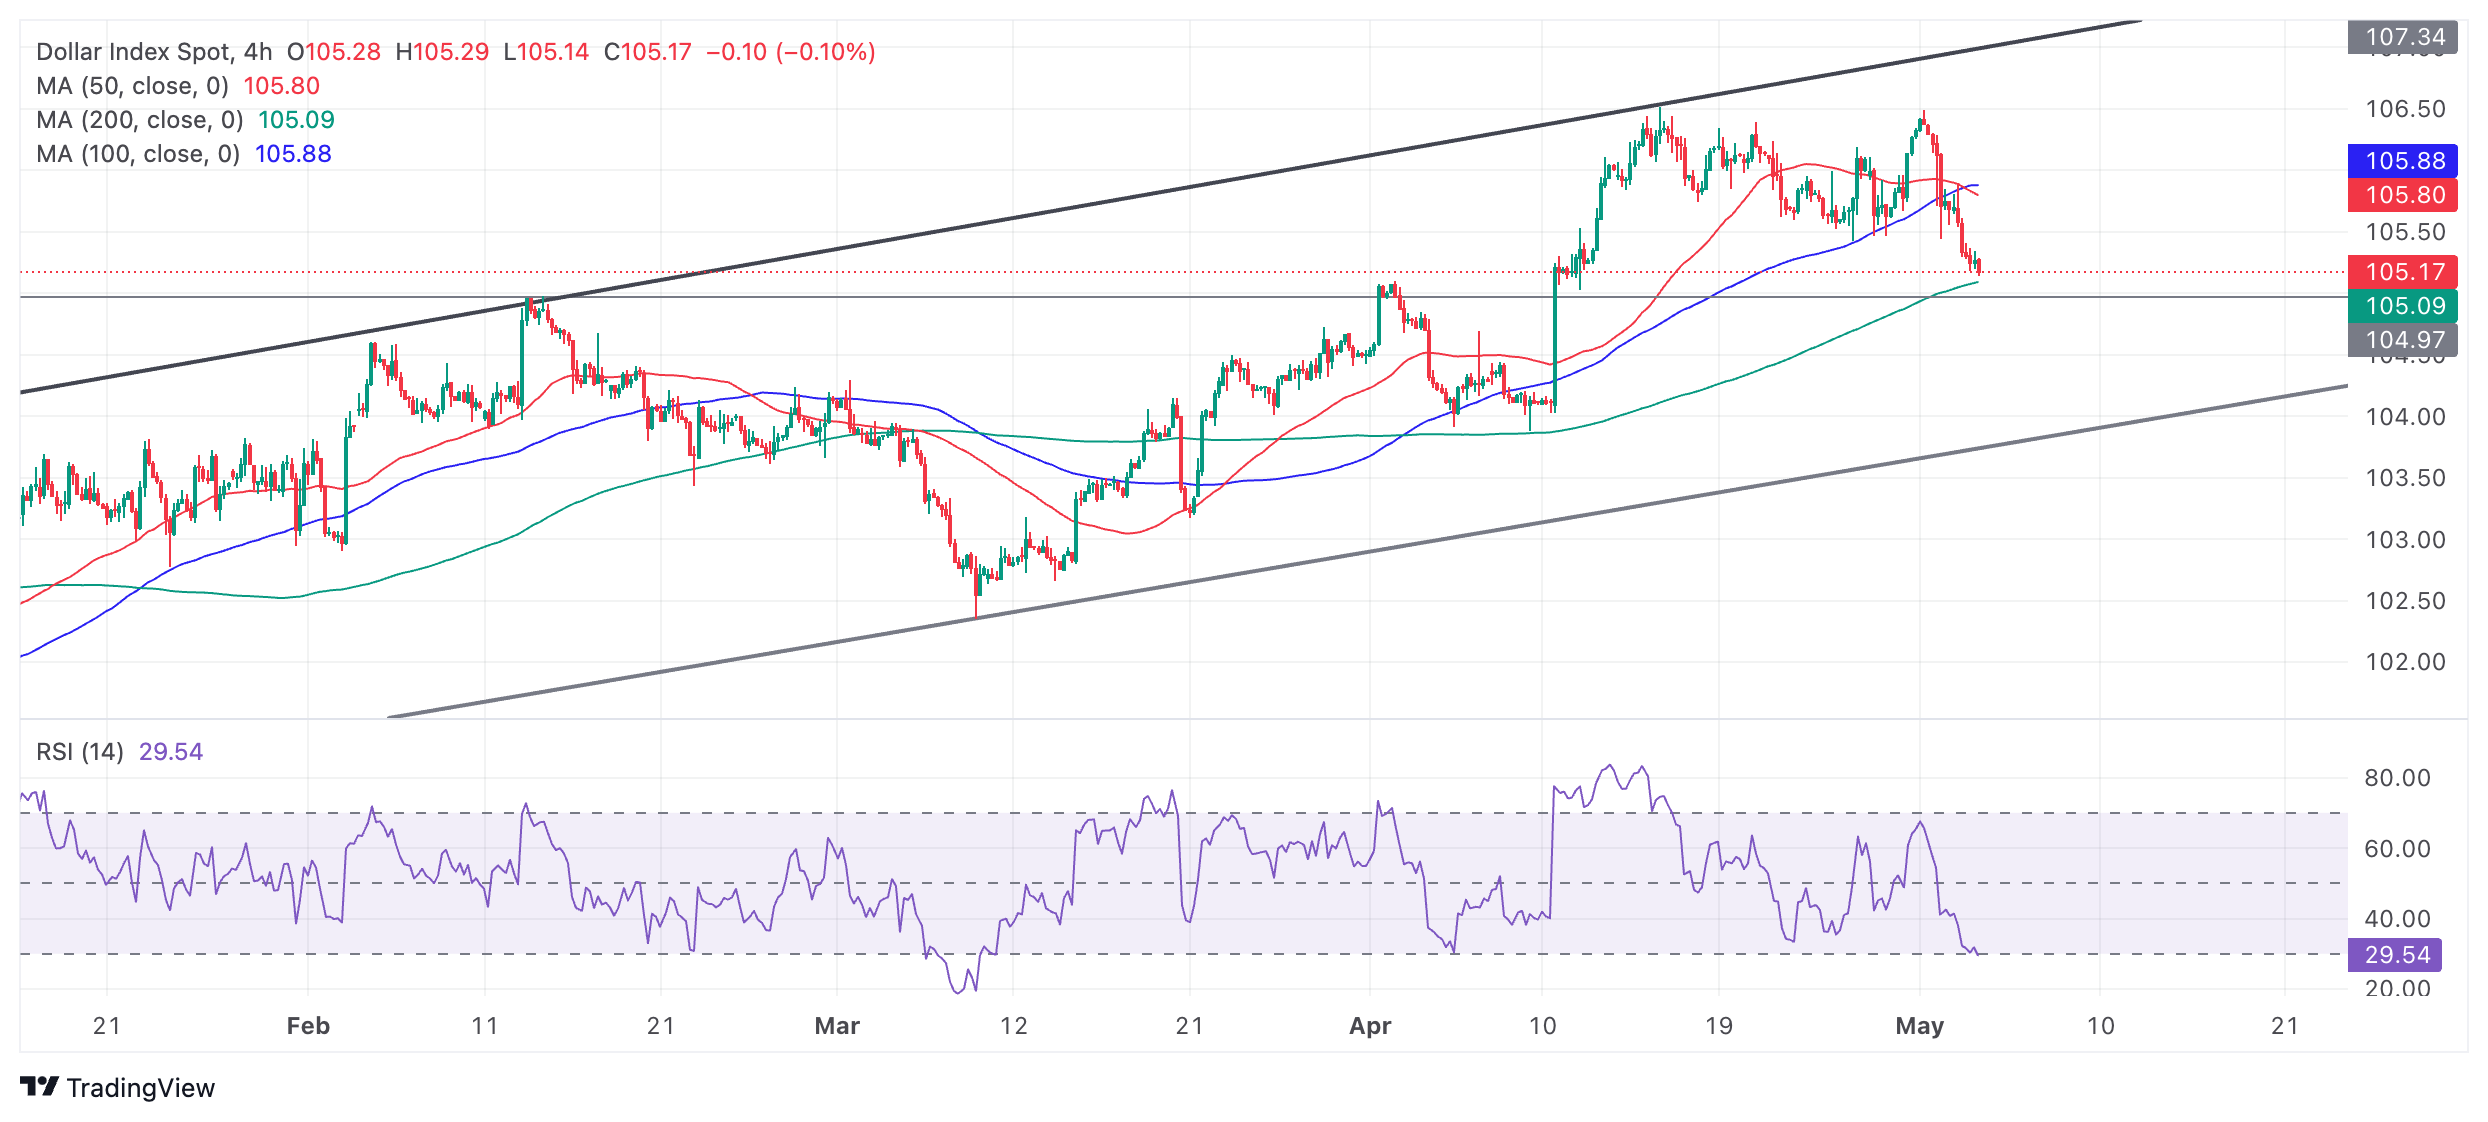
Dollar Index price is now falling close to a sturdy support level at 104.97 composed of several old peaks occurring at that height. The green 200 Simple Moving Average (SMA) also lies close at 105.09 and will probably offer support.

The probability price could find a floor is increased by the fact that the Relative Strength Index (RSI) is potentially signaling oversold – depending on the close of the current bar. If it does, then this will indicate a higher chance price could find a floor and consolidate. When RSI enters oversold it is a signal for traders not to add to their short positions. 

A decisive break below the support level at 104.97 would signal a continuation down to a possible target at the lower channel line, at that point, in the vicinity of 104.00.


Haftungsausschluss: Nur zu Informationszwecken. Die bisherige Performance ist kein verlässlicher Indikator für zukünftige Ergebnisse.
placeholder
Bitcoin, Ethereum und Ripple im freien Fall – Wo liegt der Boden?Bitcoin fällt auf 72.945 $(Tief seit Nov. 2024), Ethereum testet 2.110$. Chartanalyse zu Fibonacci-Levels, RSI-Überverkauftheit und Kurszielen.
Autor  Mitrade Team
Mi. 04.Feb
Bitcoin fällt auf 72.945 $(Tief seit Nov. 2024), Ethereum testet 2.110$. Chartanalyse zu Fibonacci-Levels, RSI-Überverkauftheit und Kurszielen.
placeholder
Der 1-Billion-Dollar-Crash: Analysten sehen "strukturellen" Kollaps bei Bitcoin und Co.Bitcoin fällt unter 65.000 $ (-11%). Analysten warnen vor strukturellem Marktversagen, illiquider Markttiefe und einem Teufelskreis aus Liquidationen.
Autor  Mitrade Team
Fr. 06.Feb
Bitcoin fällt unter 65.000 $ (-11%). Analysten warnen vor strukturellem Marktversagen, illiquider Markttiefe und einem Teufelskreis aus Liquidationen.
placeholder
MicroStrategy-Desaster: 12,6 Milliarden Dollar Verlust – Bitcoin-Wette wird zum historischen MilliardengrabMicroStrategy (MSTR) meldet 12,6 Mrd. $Verlust in Q4 2025. Bitcoin-Bestände (713k BTC) rutschen tief ins Minus (unter Cost Basis von 76k$). Aktie verliert 17%.
Autor  Mitrade Team
Fr. 06.Feb
MicroStrategy (MSTR) meldet 12,6 Mrd. $Verlust in Q4 2025. Bitcoin-Bestände (713k BTC) rutschen tief ins Minus (unter Cost Basis von 76k$). Aktie verliert 17%.
placeholder
Der 2,6-Milliarden-Dollar-Crash: Bitcoin testet 60.000 – "Extreme Angst" lähmt den Markt2,6 Mrd. $liquidiert, Bitcoin testet 60.000$. Ursachen: ETF-Abflüsse, MicroStrategy-Verlust, Bessents "No Bailout"-Ansage und Geopolitik.
Autor  Mitrade Team
Fr. 06.Feb
2,6 Mrd. $liquidiert, Bitcoin testet 60.000$. Ursachen: ETF-Abflüsse, MicroStrategy-Verlust, Bessents "No Bailout"-Ansage und Geopolitik.
placeholder
Solana-Ausverkauf: Kurs fällt unter 70 Dollar – Anleger flüchten in ScharenSOL fällt auf 67,50 $ (-23% diese Woche). Open Interest kollabiert auf 5 Mrd. $, RSI extrem überverkauft (19). Kursziel der Bären: 60 $.
Autor  Mitrade Team
Fr. 06.Feb
SOL fällt auf 67,50 $ (-23% diese Woche). Open Interest kollabiert auf 5 Mrd. $, RSI extrem überverkauft (19). Kursziel der Bären: 60 $.
verbundene Finanzinstrumente
goTop
quote