Gold plateaus after rallying to record highs

Quelle Fxstreet
  • Gold stabilizes at all-time highs after its steep rise at the end of last week. 
  • The overall trend remains bullish, and much depends on the outcome of the Fed meeting on Wednesday.  
  • Gold is in the overbought zone, according to the RSI, but in a firm uptrend on all timeframes. 

Gold (XAU/USD) is exchanging hands in the $2,580s on Monday, just below the all-time-high (ATH) of $2,589 hit earlier in the day. It has plateaued after rallying strongly on Thursday and Friday but the overall trend remains bullish. 

The initial catalyst for the rally to ATHs was a mixed US “factory gate” price inflation data, or Producer Price Index (PPI) data for August, which revealed unexpected softness in the headline figure. 

This was followed by two articles in The Wall Street Journal (WSJ) and the Financial Times (FT) that revived the case for the Fed making a relatively large 0.50% cut to its fed funds rate at its meeting on Wednesday. 

Gold surges on higher chances of a 0.50% Fed rate cut

Gold rose at the end of last week on increased chances of the Fed making a larger 0.50% cut to its key fed funds rate at its meeting on September 17-18. The expectation of lower interest rates makes the non-interest-paying precious metal more attractive to investors.  

As of Monday’s European session, the odds of the Fed cutting rates by 0.50% had risen steeply to 59% (from around 15% in the middle of last week), with a 0.25% cut fully priced in, according to the CME FedWatch tool. 

Gold may be impacted by a generally busy schedule for central banks in the week ahead. Not only will the Fed hold its policy meeting but also the Bank of England (BoE), the Bank of Japan (BoJ), and central banks in Brazil, Indonesia, Norway, Turkey and South Africa. If the general consensus is that inflation is falling and central banks are preparing to cut rates at a global level – except the BoJ – this could provide further fuel for the yellow metal’s rally.  

Technical Analysis: Gold peaks and plateaus

Gold’s price has peaked and plateaued in the $2,580s. It is overbought according to the Relative Strength Index (RSI), and this indicates that long-holders should not add to their long positions. 

If the RSI drops back out of overbought, it would be a sign to liquidate longs and open shorts. Such a move would probably indicate Gold was unfolding a correction. 

XAU/USD 4-hour Chart

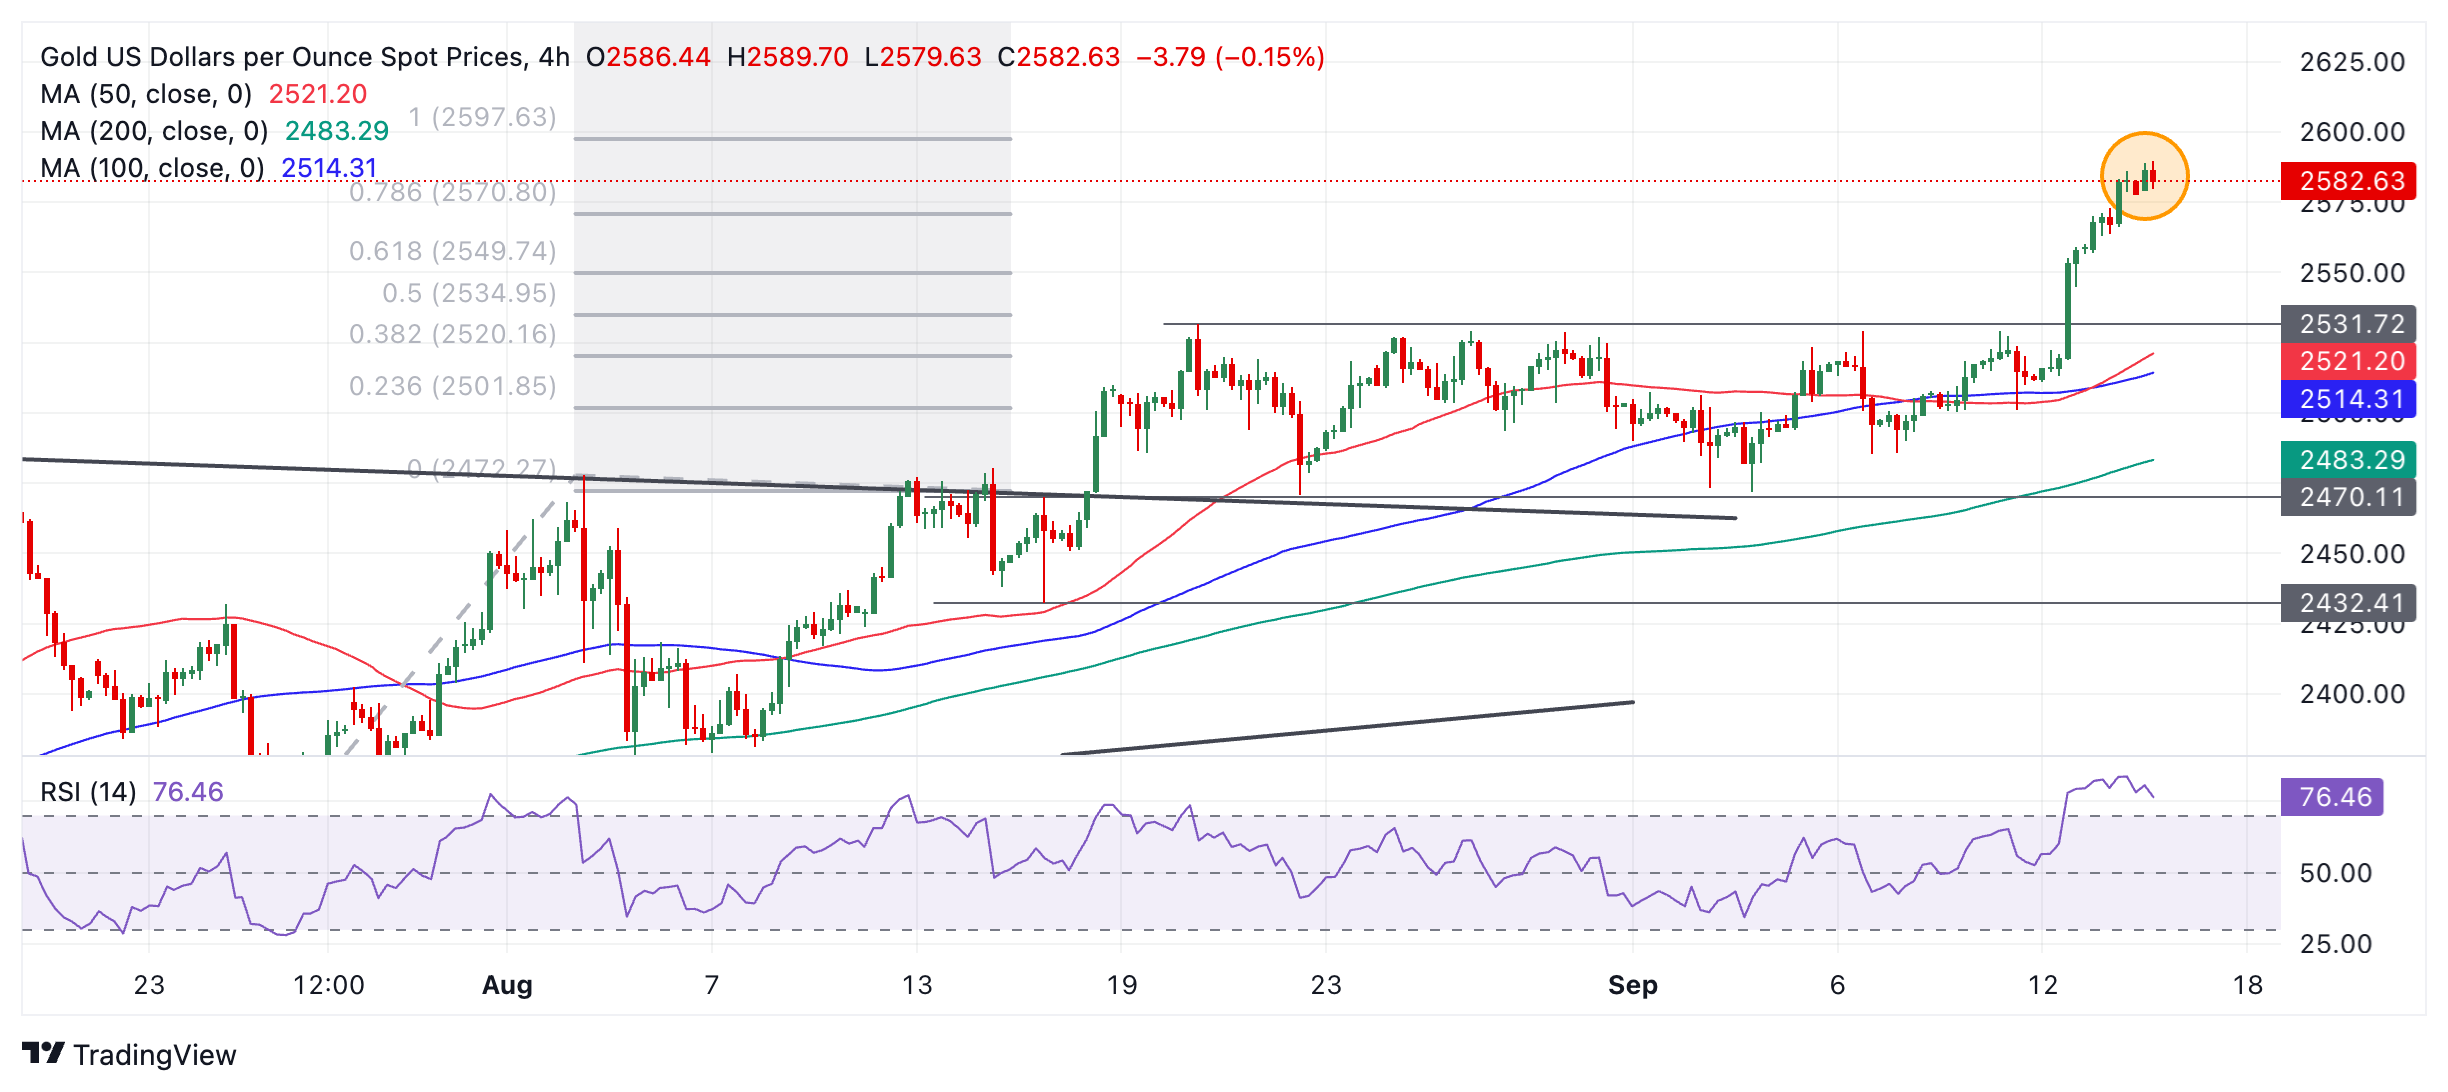
The trend is bullish in the short, medium, and long-term timeframes. Given that it is a principle of technical analysis that “the trend is your friend,” the odds favor more upside. If there is a correction, therefore, it is likely to be short-lived before Gold resumes its broader uptrend. 

The precious metal has been posting bearish-looking candles over recent periods (shaded circle). This includes a bearish Doji Star, which didn’t, however, lead to a proper pull-back. Still, the accumulation of bearish candles is a sign that the price could be slowly rolling over and about to correct back. 

In the event of a correction, firm support lies at $2,550, $2,544 (0.382 Fibonacci retracement of the September rally), and $2,530 (former range high). 

Economic Indicator

Fed Interest Rate Decision

The Federal Reserve (Fed) deliberates on monetary policy and makes a decision on interest rates at eight pre-scheduled meetings per year. It has two mandates: to keep inflation at 2%, and to maintain full employment. Its main tool for achieving this is by setting interest rates – both at which it lends to banks and banks lend to each other. If it decides to hike rates, the US Dollar (USD) tends to strengthen as it attracts more foreign capital inflows. If it cuts rates, it tends to weaken the USD as capital drains out to countries offering higher returns. If rates are left unchanged, attention turns to the tone of the Federal Open Market Committee (FOMC) statement, and whether it is hawkish (expectant of higher future interest rates), or dovish (expectant of lower future rates).

Read more.

Next release: Wed Sep 18, 2024 18:00

Frequency: Irregular

Consensus: 5.25%

Previous: 5.5%

Source: Federal Reserve


Haftungsausschluss: Nur zu Informationszwecken. Die bisherige Performance ist kein verlässlicher Indikator für zukünftige Ergebnisse.
placeholder
Ripple-Crash: 19 Mrd. weg! XRP steht vor dem gefährlichsten Punkt seit JahrenRipple (XRP) steckt in einer Phase, die viele Anleger nervös macht. Der Kurs hält sich zwar am Dienstag noch bei rund 2,25 US-Dollar, doch die Realität dahinter ist ernüchternd. Seit dem Rekordhoch von 3,66 US-Dollar am 18. Juli reiht sich ein Rückschlag an den nächsten.
Autor  FXStreet
Di. 18.Nov
Ripple (XRP) steckt in einer Phase, die viele Anleger nervös macht. Der Kurs hält sich zwar am Dienstag noch bei rund 2,25 US-Dollar, doch die Realität dahinter ist ernüchternd. Seit dem Rekordhoch von 3,66 US-Dollar am 18. Juli reiht sich ein Rückschlag an den nächsten.
placeholder
Silberpreis entfernt sich vom Wochenhoch – 50-Dollar-Zone bleibt die entscheidende TrennlinieSilber (XAG/USD) nimmt nach einem Anstieg bis 51,85 US-Dollar Abstand vom Wochenhoch, während die gebündelte Unterstützungszone um 50,00 US-Dollar mit den Marken 49,35/49,00 und 47,15–47,10 US-Dollar nach unten sowie 52,45, 53,00 und bis knapp 54,40 US-Dollar nach oben den Handlungsrahmen für kurzfristige Trader absteckt.
Autor  Mitrade Team
Gestern 03: 11
Silber (XAG/USD) nimmt nach einem Anstieg bis 51,85 US-Dollar Abstand vom Wochenhoch, während die gebündelte Unterstützungszone um 50,00 US-Dollar mit den Marken 49,35/49,00 und 47,15–47,10 US-Dollar nach unten sowie 52,45, 53,00 und bis knapp 54,40 US-Dollar nach oben den Handlungsrahmen für kurzfristige Trader absteckt.
placeholder
Bitcoin unter Druck: Der Kampf um die 90.000-Dollar-Marke und drohende AbwärtsrisikenBitcoin (BTC) ist unter 90.000 US-Dollar gefallen, handelt unter dem 100-Stunden-Durchschnitt und kämpft mit Widerständen bei 87.000, 89.000 und 91.000 US-Dollar, während Unterstützungen bei 85.500, 85.000, 83.200, 82.500 und insbesondere 80.000 US-Dollar über die nächsten Kursbewegungen entscheiden.
Autor  Mitrade Team
vor 9 Stunden
Bitcoin (BTC) ist unter 90.000 US-Dollar gefallen, handelt unter dem 100-Stunden-Durchschnitt und kämpft mit Widerständen bei 87.000, 89.000 und 91.000 US-Dollar, während Unterstützungen bei 85.500, 85.000, 83.200, 82.500 und insbesondere 80.000 US-Dollar über die nächsten Kursbewegungen entscheiden.
placeholder
Top 3 Kursprognose: Bitcoin, Ethereum, Ripple – Bärenmarkt festigt sich, BTC, ETH und XRP unter hohem VerkaufsdruckBitcoin, Ethereum und XRP haben in dieser Woche rund 8 %, 9 % bzw. 10 % verloren; BTC fällt unter 86.000 US-Dollar, ETH unter 2.900 US-Dollar und XRP unter 2 US-Dollar, wobei Unterstützungen bei 85.000/80.000 (BTC), 2.749/3.017 (ETH) und 1.77/2.35 US-Dollar (XRP) über eine mögliche kurzfristige Gegenbewegung oder eine Fortsetzung der Korrektur entscheiden.
Autor  Mitrade Team
vor 7 Stunden
Bitcoin, Ethereum und XRP haben in dieser Woche rund 8 %, 9 % bzw. 10 % verloren; BTC fällt unter 86.000 US-Dollar, ETH unter 2.900 US-Dollar und XRP unter 2 US-Dollar, wobei Unterstützungen bei 85.000/80.000 (BTC), 2.749/3.017 (ETH) und 1.77/2.35 US-Dollar (XRP) über eine mögliche kurzfristige Gegenbewegung oder eine Fortsetzung der Korrektur entscheiden.
placeholder
Silberpreis-Prognose: XAG/USD markiert Wochentief bei 49,50 $ – Marktzweifel an Fed-Senkung wachsenSilber (XAG/USD) fällt am Freitag auf ein Wochentief um 49,50 US-Dollar, da der Markt mit nur rund 35,5 % Wahrscheinlichkeit von einer Fed-Zinssenkung im Dezember ausgeht, während hartnäckige Inflationssorgen, eine Arbeitslosenquote von 4,4 % und der Kampf um die Zone um den 20-Tage-EMA zwischen der Unterstützung bei 44,47 US-Dollar und dem Rekordhoch bei 54,50 US-Dollar die weitere Richtung vorgeben.
Autor  Mitrade Team
vor 6 Stunden
Silber (XAG/USD) fällt am Freitag auf ein Wochentief um 49,50 US-Dollar, da der Markt mit nur rund 35,5 % Wahrscheinlichkeit von einer Fed-Zinssenkung im Dezember ausgeht, während hartnäckige Inflationssorgen, eine Arbeitslosenquote von 4,4 % und der Kampf um die Zone um den 20-Tage-EMA zwischen der Unterstützung bei 44,47 US-Dollar und dem Rekordhoch bei 54,50 US-Dollar die weitere Richtung vorgeben.
verbundene Finanzinstrumente
goTop
quote