

Crude Oil bottoms out as OPEC mulls delaying supply increase
- Crude Oil edges up slightly towards $70 after extending losses on Wednesday.
- OPEC is close to striking a deal to delay its production boost in order to support Oil prices.
- The US Dollar Index trades just above 101.00 amid renewed downward pressure.
Crude Oil pops higher on Thursday, near 1% on the day, amid headlines that OPEC has a deal within reach to delay the foreseen production normalization. The initial plan for the Oil cartel was to boost production by 180,000 additional barrels per day in October, but the recent downbeat demand outlook could put prices on a further downward trajectory if OPEC opens the floodgates too soon and too quickly.
The US Dollar Index (DXY), which tracks the performance of the US Dollar against a basket of currencies, is falling towards 101.00 after the US JOLTS Job Openings data on Wednesday suggested labor market conditions are easing quickly. Not only the previous month’s numbers were revised downwards, but also the actual July number came in far below 8 million. In this scenario, markets are starting to price in more rate cuts from the US Federal Reserve (Fed), weighing on the US Dollar.
On Thursday, traders will look into the ADP Employment report and Weekly Jobless Claims for more clues about the state of the US labor market.
At the time of writing, Crude Oil (WTI) trades at $69.34 and Brent Crude at $73.21.
Oil news and market movers: OPEC keeps shouting
- Bloomberg reports on Thursday that, according to several delegates, OPEC+ is close to a deal to postpone the increase in Oil supply.
- The Bloomberg Commodity Index might keep sliding lower with US recession fears emerging, which could mean more downturn for Crude Oil prices, Bloomberg reports.
- Reuters reports that Malaysia’s national Oil company Petroliam Nasional Bhd. (Petronas) has posted a 19% decline in first-half net income due to higher taxes and a shrinking of its asset base.
- The Energy Information Administration (EIA) will report on Thursday the US Crude Oil stockpile change for the week ending August 30. The previous number was a draw by 846,000 barrels, with a 900,000 drawdown expected.
- The US Crude Oil Stockpile change from the American Petroleum Institute (API) showed a sharp drawdown of 7.8 million barrels, more than doubling the 3.4 million reduction a week earlier and the 900,000 decline expected by markets.
Oil Technical Analysis: Patience is a virtue
Crude Oil’s price action is likely to be very tricky. From a purely technical standpoint, Crude prices could still inch a little bit lower before finally finding vital support to bounce off on. That thesis is confirmed by the Relative Strength Index (RSI) momentum indicator, which has not touched or tested the oversold region, giving a false impression that the rebound has started already. Still, fundamental factors matter more here and the devil will be in the details of the postponement from OPEC. This delay appears to be the minimum needed to keep Crude Oil prices afloat at the current levels.
On the upside, the lost $75.27 will be the first level to head back to. Next up, the double level at $77.43 aligns with both a descending trendline and the 200-day Simple Moving Average (SMA). In case bulls are able to break above it, the 100-day SMA at $78.00 could trigger a rejection.
On the downside, the low from August 5 at $71.17 has been broken. From here, the $68.00 big figure is the first level to watch, followed by $67.11, which is the lowest point from the triple bottom seen back in June 2023.
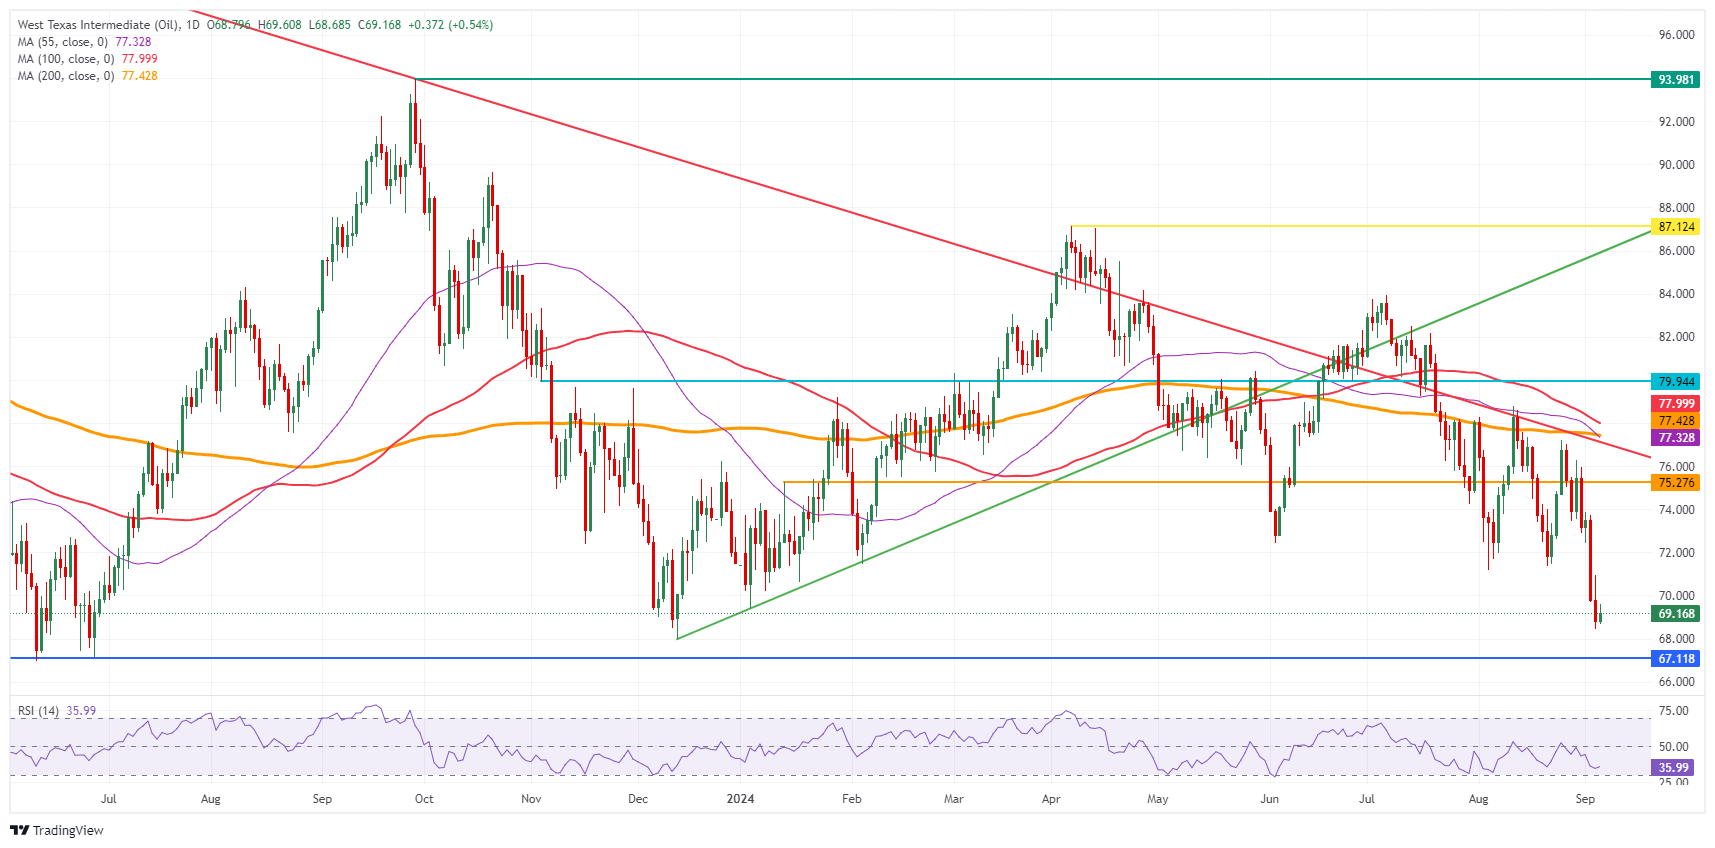
US WTI Crude Oil: Daily Chart
WTI Oil FAQs
WTI Oil is a type of Crude Oil sold on international markets. The WTI stands for West Texas Intermediate, one of three major types including Brent and Dubai Crude. WTI is also referred to as “light” and “sweet” because of its relatively low gravity and sulfur content respectively. It is considered a high quality Oil that is easily refined. It is sourced in the United States and distributed via the Cushing hub, which is considered “The Pipeline Crossroads of the World”. It is a benchmark for the Oil market and WTI price is frequently quoted in the media.
Like all assets, supply and demand are the key drivers of WTI Oil price. As such, global growth can be a driver of increased demand and vice versa for weak global growth. Political instability, wars, and sanctions can disrupt supply and impact prices. The decisions of OPEC, a group of major Oil-producing countries, is another key driver of price. The value of the US Dollar influences the price of WTI Crude Oil, since Oil is predominantly traded in US Dollars, thus a weaker US Dollar can make Oil more affordable and vice versa.
The weekly Oil inventory reports published by the American Petroleum Institute (API) and the Energy Information Agency (EIA) impact the price of WTI Oil. Changes in inventories reflect fluctuating supply and demand. If the data shows a drop in inventories it can indicate increased demand, pushing up Oil price. Higher inventories can reflect increased supply, pushing down prices. API’s report is published every Tuesday and EIA’s the day after. Their results are usually similar, falling within 1% of each other 75% of the time. The EIA data is considered more reliable, since it is a government agency.
OPEC (Organization of the Petroleum Exporting Countries) is a group of 13 Oil-producing nations who collectively decide production quotas for member countries at twice-yearly meetings. Their decisions often impact WTI Oil prices. When OPEC decides to lower quotas, it can tighten supply, pushing up Oil prices. When OPEC increases production, it has the opposite effect. OPEC+ refers to an expanded group that includes ten extra non-OPEC members, the most notable of which is Russia.
Empfohlene Artikel


