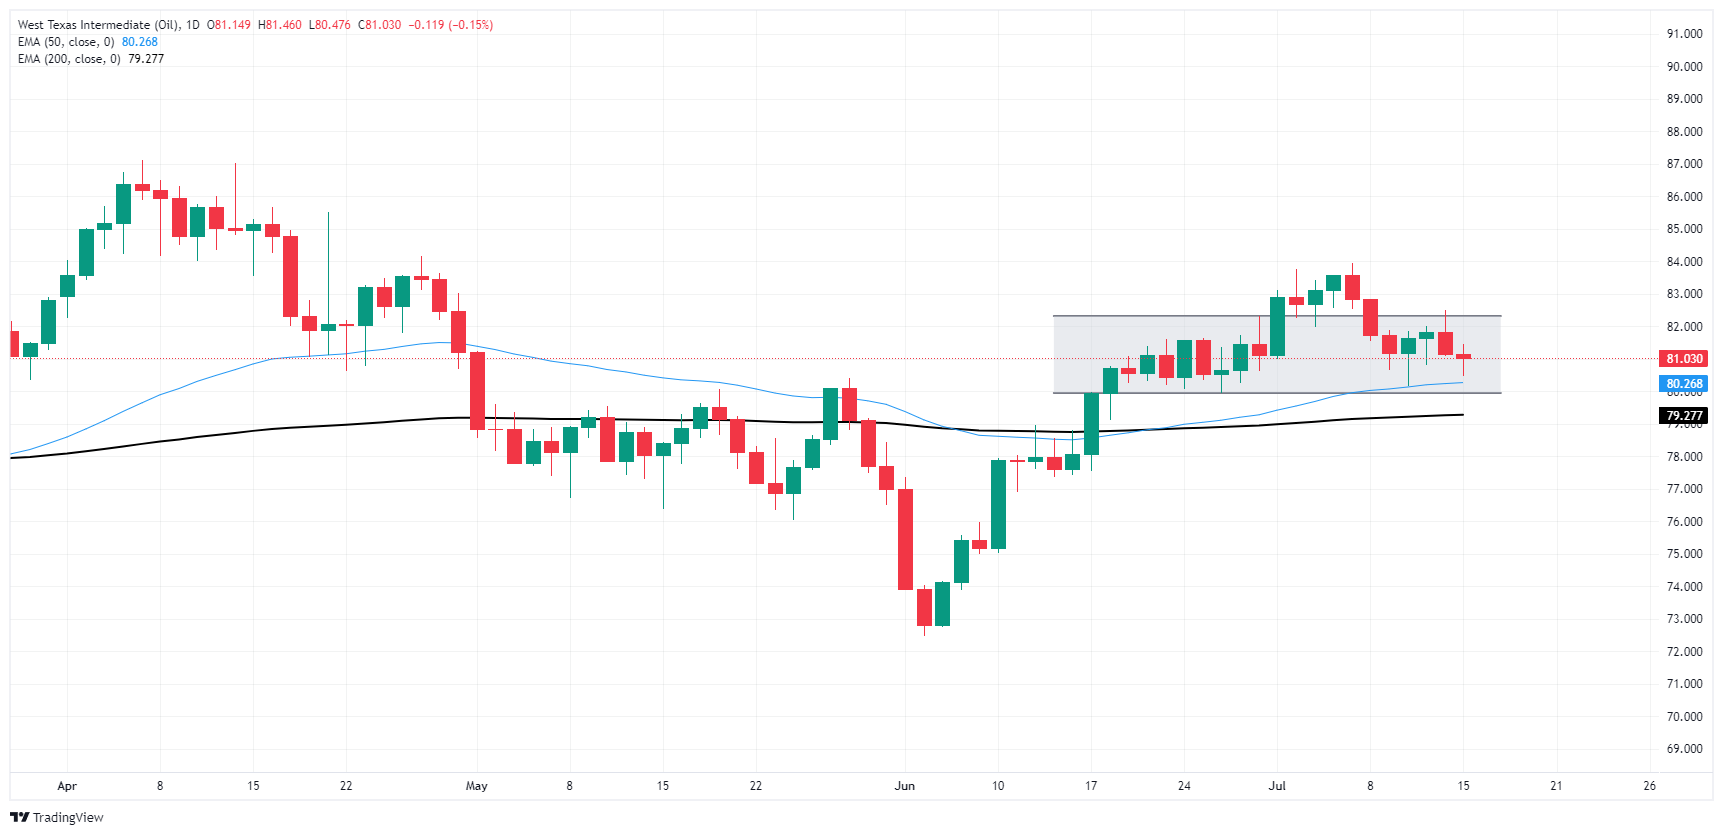
Crude Oil churns on Monday as bull run fizzles out, WTI tests below $81.00
- WTI tested back underneath $81.00 as Crude Oil markets wobble.
- Forecasts of Chinese Crude Oil demand have flipped from hopeful to fearful.
- OPEC production cuts set to begin ending at the end of September.
West Texas Intermediate (WTI) Crude Oil tested into the south end of the $81.00 handle on Monday as Crude Oil’s bullish break out of recent consolidation fizzles out. Barrel bids have been left within near-term consolidation levels, and global energy markets are running out of far-flung reasons to keep Crude Oil prices on the high end.
China reported a slowdown in quarterly Gross Domestic Product (GDP) growth recently, sparking fears that an upswing in Chinese Crude Oil demand, which has helped bolster Crude Oil prices through most of 2024, has given way to a feared slump in Chinese Crude Oil demand. WTI prices stopped just short of $84.00 per barrel in July before reversing direction and easing lower after it became clear that the uptick in Chinese fossil field demand markets spent over six months waiting for failed to materialize. Energy markets are now concerned that a steep decline in growth in China could cause barrel demand to fall even further.
The Organization of the Petroleum Exporting Countries (OPEC) and its extended non-member ally network, OPEC , is still on pace to begin ending long-standing voluntary production cuts at the end of September. The production cuts, meant to prop up floundering Crude Oil prices, are facing increasingly stiff opposition within OPEC as the small-scale countries shouldering the burden of voluntarily pumping less Crude Oil than possible rely on market participation to balance government budgets.
WTI technical outlook
WTI US Crude Oil is back to batting the $81.00 price handle, a key inflection point, after a failed bullish break out of recent consolidation. Price action holds above the 200-day Exponential Moving Average (EMA) near $79.27, and short pressure could see an extended backslide towards early June’s bottom bids near $72.45.
WTI daily chart
WTI Oil FAQs
WTI Oil is a type of Crude Oil sold on international markets. The WTI stands for West Texas Intermediate, one of three major types including Brent and Dubai Crude. WTI is also referred to as “light” and “sweet” because of its relatively low gravity and sulfur content respectively. It is considered a high quality Oil that is easily refined. It is sourced in the United States and distributed via the Cushing hub, which is considered “The Pipeline Crossroads of the World”. It is a benchmark for the Oil market and WTI price is frequently quoted in the media.
Like all assets, supply and demand are the key drivers of WTI Oil price. As such, global growth can be a driver of increased demand and vice versa for weak global growth. Political instability, wars, and sanctions can disrupt supply and impact prices. The decisions of OPEC, a group of major Oil-producing countries, is another key driver of price. The value of the US Dollar influences the price of WTI Crude Oil, since Oil is predominantly traded in US Dollars, thus a weaker US Dollar can make Oil more affordable and vice versa.
The weekly Oil inventory reports published by the American Petroleum Institute (API) and the Energy Information Agency (EIA) impact the price of WTI Oil. Changes in inventories reflect fluctuating supply and demand. If the data shows a drop in inventories it can indicate increased demand, pushing up Oil price. Higher inventories can reflect increased supply, pushing down prices. API’s report is published every Tuesday and EIA’s the day after. Their results are usually similar, falling within 1% of each other 75% of the time. The EIA data is considered more reliable, since it is a government agency.
OPEC (Organization of the Petroleum Exporting Countries) is a group of 13 Oil-producing nations who collectively decide production quotas for member countries at twice-yearly meetings. Their decisions often impact WTI Oil prices. When OPEC decides to lower quotas, it can tighten supply, pushing up Oil prices. When OPEC increases production, it has the opposite effect. OPEC refers to an expanded group that includes ten extra non-OPEC members, the most notable of which is Russia.


