

Silver Price Analysis: XAG/USD trims losses, remains bullish and clings above $30.00

Quelle Fxstreet
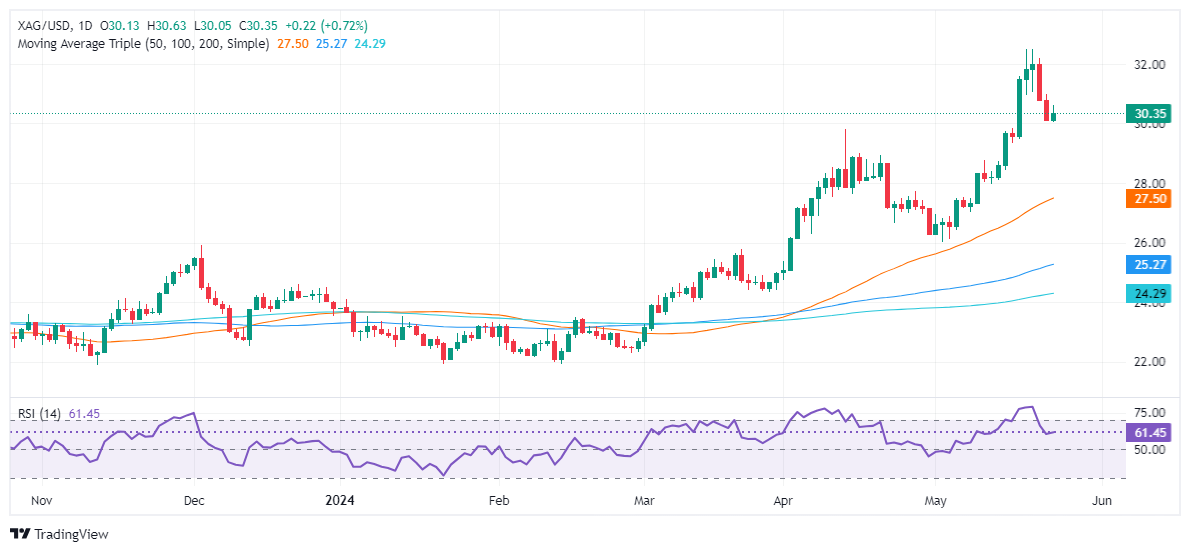
  • Silver climbs 0.59%, trading at $30.30, recovering from near-weekly lows of $30.00.
  • Softer-than-expected US Durable Goods data and improved consumer sentiment support Silver prices.
  • RSI remains bullish, indicating strong buyer momentum despite exiting overbought conditions.

Silver prices trimmed some of Thursday’s losses yet remain near the weekly lows of $30.00; exchange hands at $30.30 are up 0.59% at the time of writing. The grey metal was boosted by softer-than-expected US Durable Goods data, while American consumer sentiment improved.

XAG/USD Price Analysis: Technical outlook

The grey metal is upward biased, and the XAG/USD clinging to gains above $30.00 could pave the way for further upside. After the Relative Strength Index (RSI) exited overbought conditions, it remains bullish and aiming up, hinting that the buyer's momentum remains strong.

With that said, the XAG/USD first resistance would be the May 23 high of $30.97. A breach of the latter will expose the $31.50 figure, followed by $32.00, and the year-to-date (YTD) high reached on May 20 at $32.51.

Conversely, XAG/USD's first support would be the $30.00 psychological level. If further weakness occurs, the next support level would be the April 12 high, now turned support, at $29.79, followed by $29.00. Additional key support levels include the May 18, 2021, high at $28.74 and the June 10, 2021, high at $28.28.

XAG/USD Price Action – Daily Chart
XAG/USD

Overview
Today last price 30.36
Today Daily Change 0.23
Today Daily Change % 0.76
Today daily open 30.13
 
Trends
Daily SMA20 28.57
Daily SMA50 27.39
Daily SMA100 25.2
Daily SMA200 24.25
 
Levels
Previous Daily High 30.98
Previous Daily Low 30.07
Previous Weekly High 31.6
Previous Weekly Low 27.97
Previous Monthly High 29.8
Previous Monthly Low 24.75
Daily Fibonacci 38.2% 30.42
Daily Fibonacci 61.8% 30.63
Daily Pivot Point S1 29.8
Daily Pivot Point S2 29.48
Daily Pivot Point S3 28.89
Daily Pivot Point R1 30.72
Daily Pivot Point R2 31.31
Daily Pivot Point R3 31.63


Haftungsausschluss: Nur zu Informationszwecken. Die bisherige Performance ist kein verlässlicher Indikator für zukünftige Ergebnisse.
placeholder
Klimakiller KI: So plündern Big Techs unsere EnergiereservenInvesting.com – Der immense Stromverbrauch von Blockchains wie Bitcoin und Ethereum stand über viele Jahre hinweg im Fokus und wurde stets damit in Verbindung gebracht, wie umweltschädlich diese Techn
Autor  Investing.com
16.Jul. 2024
Investing.com – Der immense Stromverbrauch von Blockchains wie Bitcoin und Ethereum stand über viele Jahre hinweg im Fokus und wurde stets damit in Verbindung gebracht, wie umweltschädlich diese Techn
placeholder
Goldpreis Prognose: 75 Prozent Rally! Droht jetzt der Absturz?Der Goldpreis hat Anleger in den vergangenen Monaten elektrisiert. Erst der Durchbruch über die magische Marke von 5.000 US-Dollar, dann neue Hochs – und jetzt der Dämpfer.
Autor  FXStreet
Mi. 25.Feb
Der Goldpreis hat Anleger in den vergangenen Monaten elektrisiert. Erst der Durchbruch über die magische Marke von 5.000 US-Dollar, dann neue Hochs – und jetzt der Dämpfer.
placeholder
Goldpreis Prognose: Fed-Termin am 17. Juni als KurstreiberDer Goldpreis steht vor der Entscheidung. Und genau diese Phase kann für Anleger besonders gefährlich werden.
Autor  FXStreet
Di. 09.Jun
Der Goldpreis steht vor der Entscheidung. Und genau diese Phase kann für Anleger besonders gefährlich werden.
placeholder
Bitcoin-Kursprognose: BTC steigt auf 70.000-Dollar-Marke, könnte um weitere 17 % steigenTradingKey – Am 20. August stieg Bitcoin (BTC) kräftig an und erreichte die wichtige Marke von 70.000 US-Dollar, was ein neues Hoch seit Februar dieses Jahres markierte. In den vergangenen 24 Stunden
Autor  Mitrade Team
Do. 20.Aug
TradingKey – Am 20. August stieg Bitcoin (BTC) kräftig an und erreichte die wichtige Marke von 70.000 US-Dollar, was ein neues Hoch seit Februar dieses Jahres markierte. In den vergangenen 24 Stunden
placeholder
Ethereum-Preisprognose: ETH durchbricht 2.300 $ am fünften Tag in Folge; wie lange kann die Bullenrallye anhalten?TradingKey – Ethereum legt den fünften Handelstag in Folge zu und nimmt als Nächstes die Marke von 2.800 US-Dollar ins Visier.Am 21. August setzte Ethereum (ETH) seine Rally fort, durchbrach die Marke
Autor  Mitrade Team
Gestern 07: 40
TradingKey – Ethereum legt den fünften Handelstag in Folge zu und nimmt als Nächstes die Marke von 2.800 US-Dollar ins Visier.Am 21. August setzte Ethereum (ETH) seine Rally fort, durchbrach die Marke
verbundene Finanzinstrumente
goTop
quote