NZD/JPY price analysis: Bullish momentum dominates, indicators flash overbought conditions

Quelle Fxstreet
  • The NZD/JPY pair rallied by 0.53% and stands at 92.88 as of Wednesday's session.
  • The daily RSI shows strong buying momentum, reaching overbought conditions.
  • A healthy technical correction may be on the horizon in the next sessions.

In Wednesday's session, the NZD/JPY was observed trading at 92.88, marking a 0.53% rally in its progress. The pair reveals sustained buying momentum with the Relative Strength Index (RSI), dwelling in the overbought zone indicating that a pullback may be incoming.

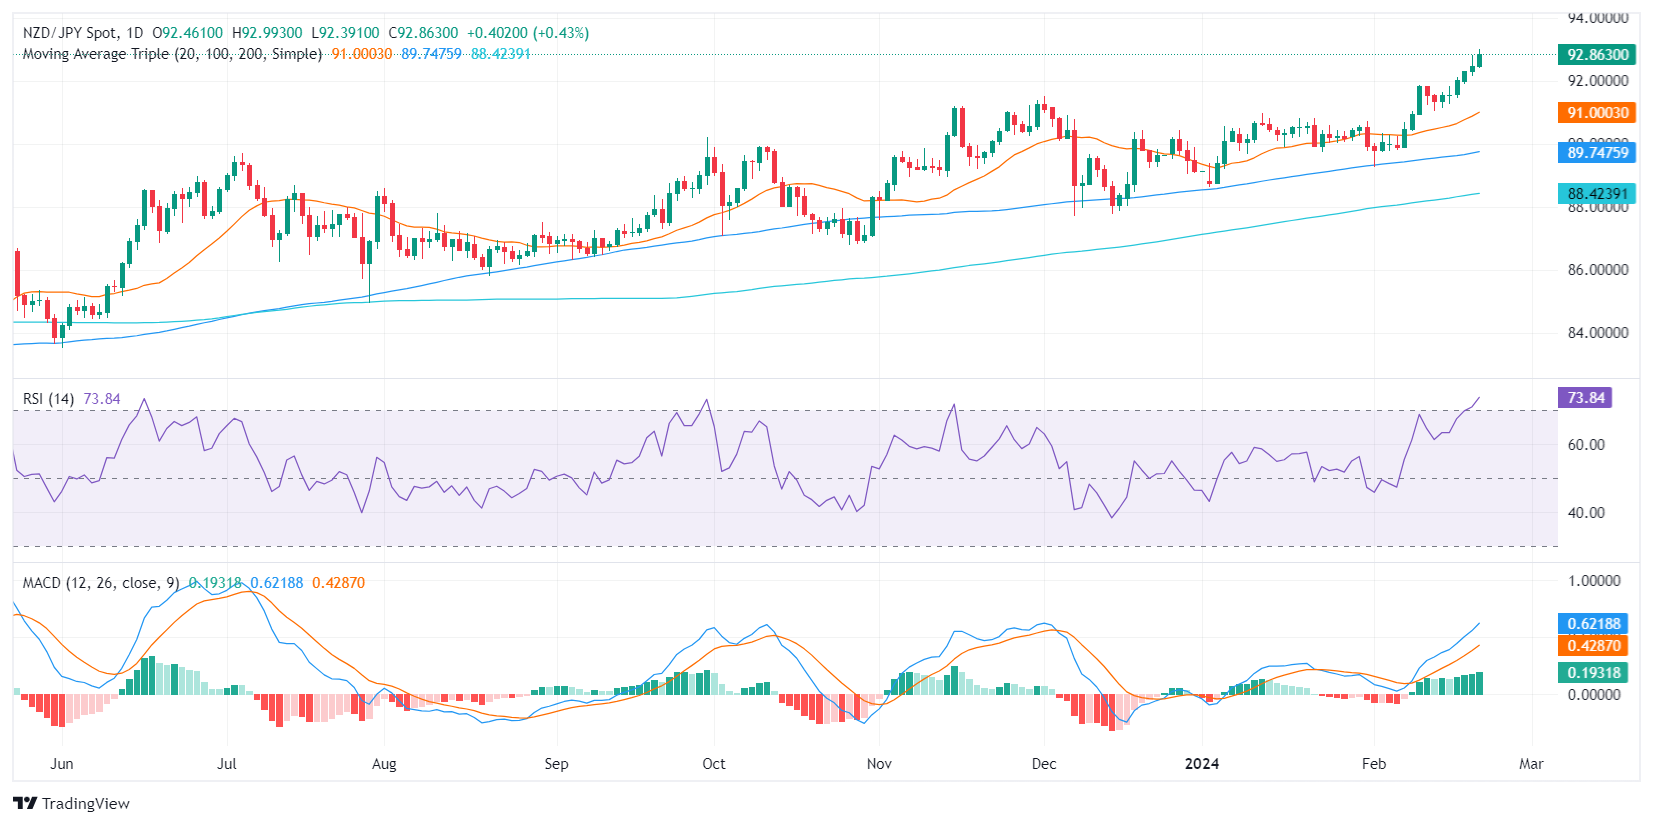
In the daily chart, the Relative Strength Index (RSI) consistently resides in the overbought, and the NZD/JPY pair shows signs of strong buying momentum. Notably, there's been a persistently positive slope, indicating a continued bullish undercurrent. To support this, the Moving Average Convergence Divergence (MACD) histogram is displaying green bars, marking positive momentum. It's been on a steady rise, further underlining the dominance of buyers.

NZD/JPY daily chart

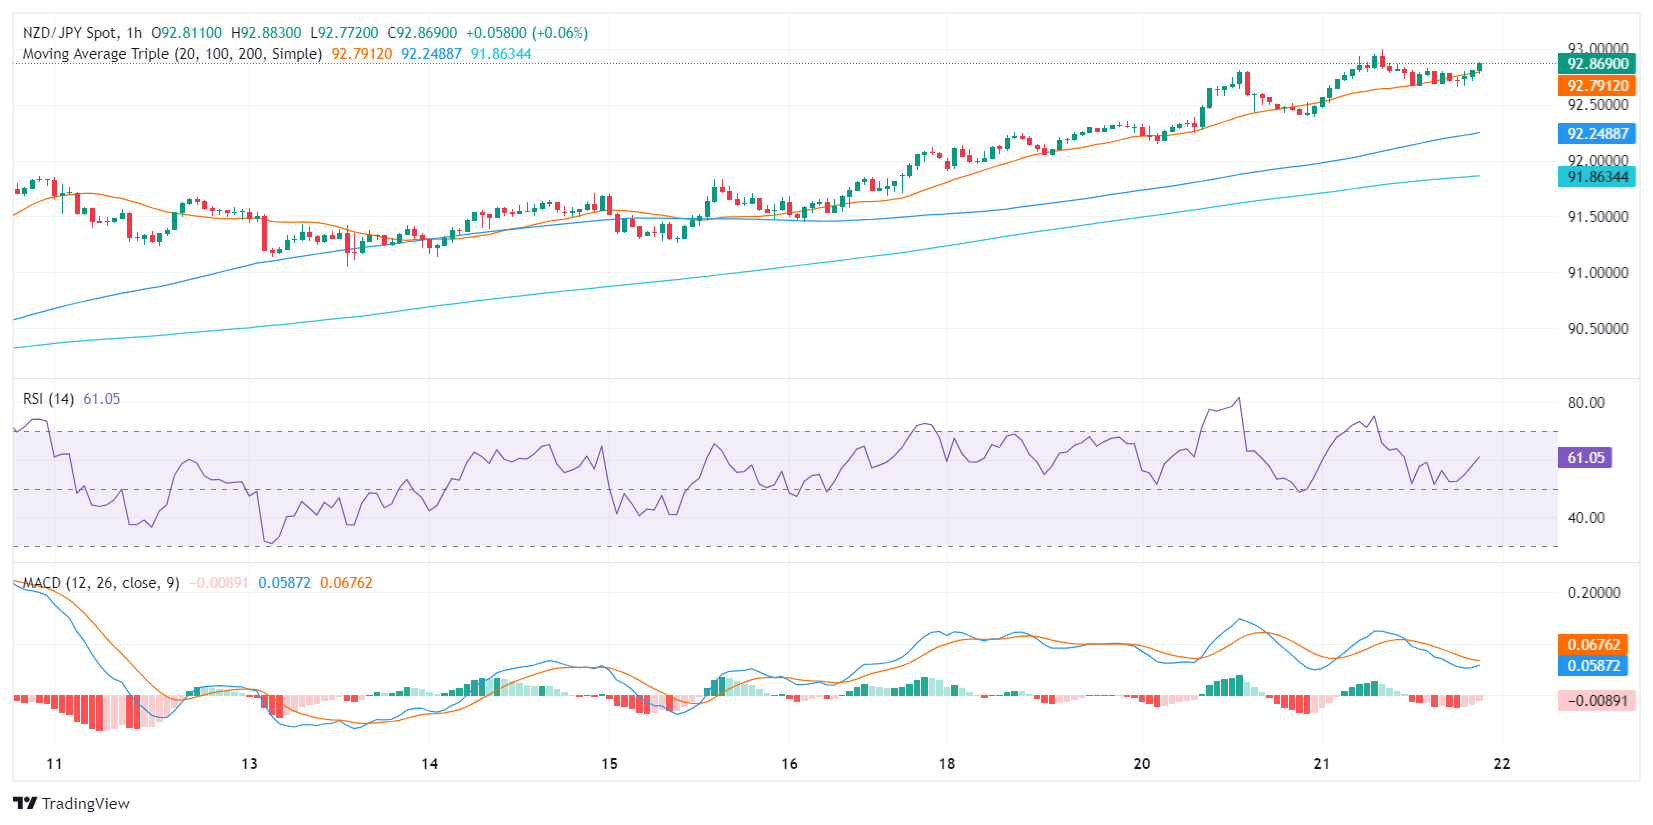
Shifting attention to the hourly chart, the RSI hovers flat in both the positive area and the MACD histogram continues to print green bars, alluding to an overall bullish momentum despite interim dips.

NZD/JPY hourly chart

Overall, despite the short-term flattening depicted in the hourly chart, the significant bullish signals from the daily RSI and both MACD histograms suggest the pair might adhere to an upward trend. Moreover, the NZDJPY stands above its 20,100,200-day Simple Moving Averages (SMAs), reinforcing the predominance of the bulls. However, traders should consider the possibility of a correction in the next session, to consolidate gains.


Haftungsausschluss: Nur zu Informationszwecken. Die bisherige Performance ist kein verlässlicher Indikator für zukünftige Ergebnisse.
placeholder
Bitcoin, Ethereum und Ripple im freien Fall – Wo liegt der Boden?Bitcoin fällt auf 72.945 $(Tief seit Nov. 2024), Ethereum testet 2.110$. Chartanalyse zu Fibonacci-Levels, RSI-Überverkauftheit und Kurszielen.
Autor  Mitrade Team
Mi. 04.Feb
Bitcoin fällt auf 72.945 $(Tief seit Nov. 2024), Ethereum testet 2.110$. Chartanalyse zu Fibonacci-Levels, RSI-Überverkauftheit und Kurszielen.
placeholder
Silber bricht um 16% ein: Was steckt wirklich hinter dem Silberpreis-Crash?Silber crasht. Und zwar richtig. Wer heute Morgen einen Blick auf die Kurse geworfen hat, dürfte sich verwundert die Augen gerieben haben.
Autor  FXStreet
Do. 05.Feb
Silber crasht. Und zwar richtig. Wer heute Morgen einen Blick auf die Kurse geworfen hat, dürfte sich verwundert die Augen gerieben haben.
placeholder
XRP bei 1,60 Dollar: Diese Ripple-Marke entscheidet jetzt über Crash oder ComebackRipple (XRP) steht am Donnerstag genau dort, wo sich entscheidet, ob die Korrektur vorbei ist oder erst richtig beginnt.
Autor  FXStreet
Do. 05.Feb
Ripple (XRP) steht am Donnerstag genau dort, wo sich entscheidet, ob die Korrektur vorbei ist oder erst richtig beginnt.
placeholder
MicroStrategy-Desaster: 12,6 Milliarden Dollar Verlust – Bitcoin-Wette wird zum historischen MilliardengrabMicroStrategy (MSTR) meldet 12,6 Mrd. $Verlust in Q4 2025. Bitcoin-Bestände (713k BTC) rutschen tief ins Minus (unter Cost Basis von 76k$). Aktie verliert 17%.
Autor  Mitrade Team
Gestern 02: 47
MicroStrategy (MSTR) meldet 12,6 Mrd. $Verlust in Q4 2025. Bitcoin-Bestände (713k BTC) rutschen tief ins Minus (unter Cost Basis von 76k$). Aktie verliert 17%.
placeholder
Der 2,6-Milliarden-Dollar-Crash: Bitcoin testet 60.000 – "Extreme Angst" lähmt den Markt2,6 Mrd. $liquidiert, Bitcoin testet 60.000$. Ursachen: ETF-Abflüsse, MicroStrategy-Verlust, Bessents "No Bailout"-Ansage und Geopolitik.
Autor  Mitrade Team
vor 21 Stunden
2,6 Mrd. $liquidiert, Bitcoin testet 60.000$. Ursachen: ETF-Abflüsse, MicroStrategy-Verlust, Bessents "No Bailout"-Ansage und Geopolitik.
verbundene Finanzinstrumente
goTop
quote