Mexican Peso on the defensive as traders await Retail Sales data

Quelle Fxstreet
  • Mexican Peso edges down after recovering over the past five trading days, exchanging hands at 18.41 against the US Dollar.
  • Political developments, including judiciary reform, weigh on sentiment, sparking flows out of the Peso.
  • Fed officials maintain cautious stance on inflation, affecting market expectations on monetary policy.

The Mexican Peso registers minuscule losses versus the US Dollar on Wednesday after recovering some ground in the last five trading days. A scarce economic docket in Mexico and the United States (US) leaves the emerging market currency leaning on political developments. The USD/MXN trades at 18.41, up 0.08%.

Traders remain risk averse as European bourses finished Wednesday’s session with losses. The Greenback trades with losses against most G7 currencies while advancing against emerging market currencies.

Data from Mexico suggests the economy remains robust, while traders eye the release of April’s Retail Sales report. In the meantime, investors remain attentive to politics after President Andres Manuel Lopez Obrador (AMLO) reiterated that the judiciary reform would likely be approved in September.

On Monday, presumptive President Claudia Sheinbaum revealed a poll in which citizens approved a reform that allows the popular election of Supreme Court ministers, magistrates and judges. “These polls are information, they don't have another objective,” Sheinbaum said in a press conference. “This is just information to be considered in the discussions starting in the coming days.”

Aside from this, Federal Reserve officials remained cautious about inflation and the commencement of the easing cycle. Most considered inflation high, monetary policy appropriate, and the possibility of cutting rates once they gain confidence in the disinflation process.

Although policymakers are not considering a rate hike, St. Louis Fed President Alberto Musalem stated that if inflation stalls, he will favor an increase to the fed funds rate.

Despite that, the USD/MXN exchange rate would continue to be driven by political uncertainty as some of the reforms pushed by AMLO to change the Mexican Constitution threaten the state of law.

Daily digest market movers: Mexican Peso on defensive amid risk aversion

  • Mexican Retail Sales are expected to decrease further, estimated at -0.3% MoM, worse than March’s -0.2% contraction. They are expected to jump from -1.7% to 1.5% for the twelve months to April.
  • USD/MXN stabilizes following last week’s verbal intervention by Banxico Governor Victoria Rodriguez Ceja, who said the central bank is attentive to volatility in the Mexican currency exchange rate and could act to restore “order” in markets.
  • Wednesday’s data and Mexican currency depreciation could deter Banxico from easing its policy at the next meeting on June 27. A rate cut could weaken the Mexican Peso and expose the USD/MXN year-to-date high at 18.99.
  • CME FedWatch Tool shows odds for a 25-basis-point rate cut by the Fed stand at 59.5%, down from 62% a day ago.

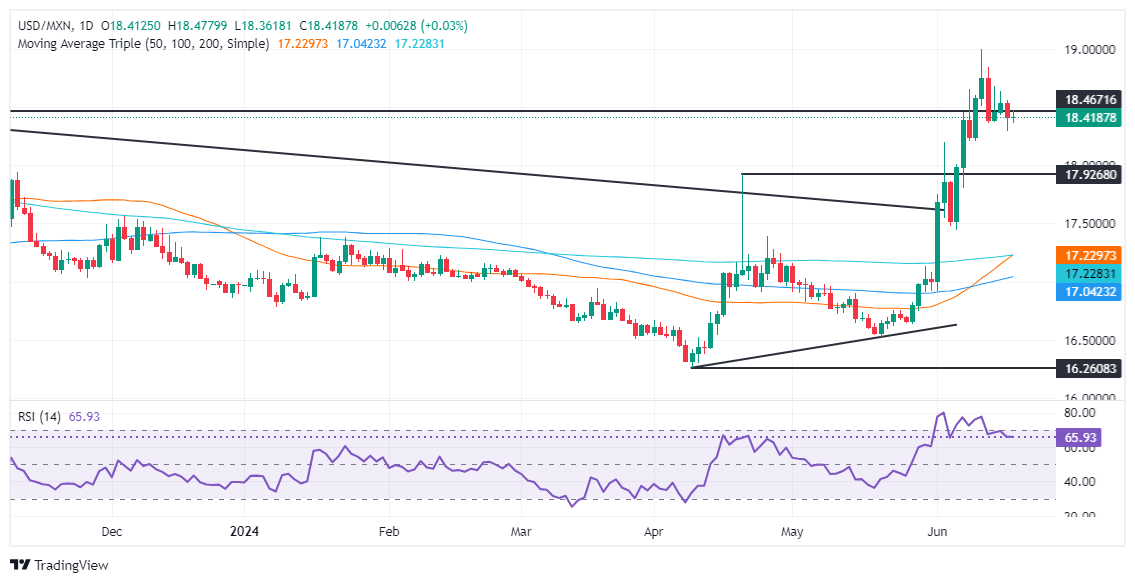
Technical analysis: Mexican Peso wavers around 18.40

The USD/MXN uptrend continues even though the pair dipped to a five-day low of 18.29 as momentum shows buyers are in charge. The Relative Strength Index (RSI) is bullish above the 50-neutral line, hinting that bullish momentum is intact.

For a bullish continuation, the USD/MXN must clear 18.50 if buyers want to retest the year-to-date high of 18.99. A breach of the latter will expose the March 20, 2023, high of 19.23. If cleared, that will sponsor an uptick to 19.50, ahead of the psychological 20.00 mark.

Conversely, if sellers push prices below the April 19 high of 18.15, the exotic pair will be kept within the 18.00-18.15 range.

Mexican Peso FAQs

The Mexican Peso (MXN) is the most traded currency among its Latin American peers. Its value is broadly determined by the performance of the Mexican economy, the country’s central bank’s policy, the amount of foreign investment in the country and even the levels of remittances sent by Mexicans who live abroad, particularly in the United States. Geopolitical trends can also move MXN: for example, the process of nearshoring – or the decision by some firms to relocate manufacturing capacity and supply chains closer to their home countries – is also seen as a catalyst for the Mexican currency as the country is considered a key manufacturing hub in the American continent. Another catalyst for MXN is Oil prices as Mexico is a key exporter of the commodity.

The main objective of Mexico’s central bank, also known as Banxico, is to maintain inflation at low and stable levels (at or close to its target of 3%, the midpoint in a tolerance band of between 2% and 4%). To this end, the bank sets an appropriate level of interest rates. When inflation is too high, Banxico will attempt to tame it by raising interest rates, making it more expensive for households and businesses to borrow money, thus cooling demand and the overall economy. Higher interest rates are generally positive for the Mexican Peso (MXN) as they lead to higher yields, making the country a more attractive place for investors. On the contrary, lower interest rates tend to weaken MXN.

Macroeconomic data releases are key to assess the state of the economy and can have an impact on the Mexican Peso (MXN) valuation. A strong Mexican economy, based on high economic growth, low unemployment and high confidence is good for MXN. Not only does it attract more foreign investment but it may encourage the Bank of Mexico (Banxico) to increase interest rates, particularly if this strength comes together with elevated inflation. However, if economic data is weak, MXN is likely to depreciate.

As an emerging-market currency, the Mexican Peso (MXN) tends to strive during risk-on periods, or when investors perceive that broader market risks are low and thus are eager to engage with investments that carry a higher risk. Conversely, MXN tends to weaken at times of market turbulence or economic uncertainty as investors tend to sell higher-risk assets and flee to the more-stable safe havens.


Haftungsausschluss: Nur zu Informationszwecken. Die bisherige Performance ist kein verlässlicher Indikator für zukünftige Ergebnisse.
placeholder
XRP wackelt erneut: Drei Signale, die den nächsten Rücksetzer auslösen könntenXRP stabilisiert sich am Montag nahe 1,90 US-Dollar nach dem Dip auf 1,81, doch sinkende XRPL-Aktivität (45.000), ein Einbruch profitabler Bestände (50,4%) und fallendes Open Interest (3,26 Mrd. USD) halten das Risiko einer Korrektur bis 1,61 US-Dollar hoch, während Widerstände bei 2,03/2,16/2,29 US-Dollar liegen.
Autor  Mitrade Team
Di. 27.Jan
XRP stabilisiert sich am Montag nahe 1,90 US-Dollar nach dem Dip auf 1,81, doch sinkende XRPL-Aktivität (45.000), ein Einbruch profitabler Bestände (50,4%) und fallendes Open Interest (3,26 Mrd. USD) halten das Risiko einer Korrektur bis 1,61 US-Dollar hoch, während Widerstände bei 2,03/2,16/2,29 US-Dollar liegen.
placeholder
Krypto-Ausblick: Bitcoin stabilisiert sich über 87.787 US-Dollar – Ether vor der nächsten Hürde, XRP bleibt fragil• Bitcoin pendelt am Mittwoch um 89.000 US-Dollar und hat sich nach der Vorwochenkorrektur bislang um knapp 3% erholt – entscheidend bleibt die Zone um 87.787 US-Dollar. • Ethereum arbeitet sich an die Widerstandszone heran: Erst ein Tagesschluss über 3.017 US-Dollar und der 50-Tage-EMA bei 3.101 US-Dollar würde den Weg nach oben freimachen. • XRP prallt von 1,83 US-Dollar ab und steht wieder bei 1,90 US-Dollar – doch RSI und MACD sprechen weiter für Vorsicht. Nach der kräftigen Korrektur der vergangenen Woche setzt sich im Kryptomarkt eine vorsichtige Stabilisierung durch. Bitcoin, Ether und XRP bauen ihre Erholung aus, stoßen nun aber auf charttechnisch wichtige Marken, an denen sich entscheidet, ob aus der Gegenbewegung mehr wird – oder ob der nächste Rücksetzer folgt. Bitcoin: 87.787 US-Dollar bleibt der Dreh- und Angelpunkt Bitcoin hat am Montag nach der 7,48%-Korrektur der Vorwoche wieder oberhalb der Mittellinie eines horizontalen Parallelkanals bei 87.787 US-Dollar geschlossen. Am Dienstag verteidigte der Kurs diese Zone erneut, am Mittwoch notiert BTC bei rund 89.300 US-Dollar. Hält 87.787 US-Dollar als Support, rückt die obere Begrenzung des Musters bei 90.000 US-Dollar in den Fokus. Der RSI (Tag) liegt bei 45 und steigt in Richtung der neutralen 50 – ein Hinweis auf nachlassenden Verkaufsdruck. Auch der MACD entspannt sich: Die Linien nähern sich an, die roten Histogrammbalken unterhalb der Nulllinie werden schwächer. Bricht Bitcoin dagegen per Tagesschluss wieder unter 87.787 US-Dollar, bleibt die Unterseite anfällig – dann würde die nächste Auffangzone bei 85.569 US-Dollar (zugleich 78,6% Fibonacci-Retracement) wieder relevant. Ethereum: Erst über 3.017 und 3.101 US-Dollar wird es konstruktiver Ethereum startete positiv in die Woche und legte bis Dienstag um 7,62% zu – nach der 14,22%-Korrektur in der Woche davor. Am Mittwoch nähert sich ETH dem zentralen Widerstand bei 3.017 US-Dollar. Für ein klareres Erholungssignal braucht es mehr als nur Intraday-Stärke: Ein Ausbruch über 3.017 US-Dollar und ein Tagesschluss über dem 50-Tage-EMA bei 3.101 US-Dollar könnten den Blick in Richtung des Hochs vom 14. Januar bei 3.402 US-Dollar lenken. Die Momentum-Indikatoren (RSI und MACD) deuten zwar auf nachlassenden Abwärtsdruck hin, aber das Setup bleibt empfindlich. Kommt es stattdessen zu einer erneuten Abweisung an der Widerstandszone, rückt auf der Unterseite das 61,8% Fibonacci-Retracement bei 2.749 US-Dollar wieder ins Blickfeld. XRP: Rebound ja – Trendwende noch nicht XRP hat am Sonntag die tägliche Unterstützung bei 1,83 US-Dollar getestet und anschließend binnen zwei Tagen um 4,51% zugelegt. Am Mittwoch handelt der Kurs bei 1,90 US-Dollar. Solange 1,83 US-Dollar hält, kann sich die Erholung in Richtung des nächsten Widerstands bei 1,96 US-Dollar fortsetzen. Allerdings ist der Unterton noch nicht gedreht: Der RSI liegt bei 42 und damit weiter unter der neutralen 50. Zudem bleibt das Bild im MACD belastet – das bärische Crossover der Vorwoche ist weiterhin aktiv, was das Rückschlagrisiko erhöht. Fällt XRP per Tagesschluss erneut unter 1,83 US-Dollar, wäre ein weiterer Abwärtsimpuls bis zum Tief vom 19. Dezember bei 1,77 US-Dollar wieder ein realistisches Szenario.
Autor  Mitrade Team
Mi. 28.Jan
• Bitcoin pendelt am Mittwoch um 89.000 US-Dollar und hat sich nach der Vorwochenkorrektur bislang um knapp 3% erholt – entscheidend bleibt die Zone um 87.787 US-Dollar. • Ethereum arbeitet sich an die Widerstandszone heran: Erst ein Tagesschluss über 3.017 US-Dollar und der 50-Tage-EMA bei 3.101 US-Dollar würde den Weg nach oben freimachen. • XRP prallt von 1,83 US-Dollar ab und steht wieder bei 1,90 US-Dollar – doch RSI und MACD sprechen weiter für Vorsicht. Nach der kräftigen Korrektur der vergangenen Woche setzt sich im Kryptomarkt eine vorsichtige Stabilisierung durch. Bitcoin, Ether und XRP bauen ihre Erholung aus, stoßen nun aber auf charttechnisch wichtige Marken, an denen sich entscheidet, ob aus der Gegenbewegung mehr wird – oder ob der nächste Rücksetzer folgt. Bitcoin: 87.787 US-Dollar bleibt der Dreh- und Angelpunkt Bitcoin hat am Montag nach der 7,48%-Korrektur der Vorwoche wieder oberhalb der Mittellinie eines horizontalen Parallelkanals bei 87.787 US-Dollar geschlossen. Am Dienstag verteidigte der Kurs diese Zone erneut, am Mittwoch notiert BTC bei rund 89.300 US-Dollar. Hält 87.787 US-Dollar als Support, rückt die obere Begrenzung des Musters bei 90.000 US-Dollar in den Fokus. Der RSI (Tag) liegt bei 45 und steigt in Richtung der neutralen 50 – ein Hinweis auf nachlassenden Verkaufsdruck. Auch der MACD entspannt sich: Die Linien nähern sich an, die roten Histogrammbalken unterhalb der Nulllinie werden schwächer. Bricht Bitcoin dagegen per Tagesschluss wieder unter 87.787 US-Dollar, bleibt die Unterseite anfällig – dann würde die nächste Auffangzone bei 85.569 US-Dollar (zugleich 78,6% Fibonacci-Retracement) wieder relevant. Ethereum: Erst über 3.017 und 3.101 US-Dollar wird es konstruktiver Ethereum startete positiv in die Woche und legte bis Dienstag um 7,62% zu – nach der 14,22%-Korrektur in der Woche davor. Am Mittwoch nähert sich ETH dem zentralen Widerstand bei 3.017 US-Dollar. Für ein klareres Erholungssignal braucht es mehr als nur Intraday-Stärke: Ein Ausbruch über 3.017 US-Dollar und ein Tagesschluss über dem 50-Tage-EMA bei 3.101 US-Dollar könnten den Blick in Richtung des Hochs vom 14. Januar bei 3.402 US-Dollar lenken. Die Momentum-Indikatoren (RSI und MACD) deuten zwar auf nachlassenden Abwärtsdruck hin, aber das Setup bleibt empfindlich. Kommt es stattdessen zu einer erneuten Abweisung an der Widerstandszone, rückt auf der Unterseite das 61,8% Fibonacci-Retracement bei 2.749 US-Dollar wieder ins Blickfeld. XRP: Rebound ja – Trendwende noch nicht XRP hat am Sonntag die tägliche Unterstützung bei 1,83 US-Dollar getestet und anschließend binnen zwei Tagen um 4,51% zugelegt. Am Mittwoch handelt der Kurs bei 1,90 US-Dollar. Solange 1,83 US-Dollar hält, kann sich die Erholung in Richtung des nächsten Widerstands bei 1,96 US-Dollar fortsetzen. Allerdings ist der Unterton noch nicht gedreht: Der RSI liegt bei 42 und damit weiter unter der neutralen 50. Zudem bleibt das Bild im MACD belastet – das bärische Crossover der Vorwoche ist weiterhin aktiv, was das Rückschlagrisiko erhöht. Fällt XRP per Tagesschluss erneut unter 1,83 US-Dollar, wäre ein weiterer Abwärtsimpuls bis zum Tief vom 19. Dezember bei 1,77 US-Dollar wieder ein realistisches Szenario.
placeholder
Krypto-Gewinner trotz Marktpause: Worldcoin rutscht ab, Canton vor Ausbruch – Jupiter stößt am 50-Tage-EMA anWorldcoin (WLD) korrigiert nach der 25%-Rally am 100-Tage-EMA, Canton (CC) steht vor dem Breakout über $0.1624 und Jupiter (JUP) stößt nach 16% in drei Tagen am 50-Tage-EMA bei $0.2174 an.
Autor  Mitrade Team
Gestern 03: 47
Worldcoin (WLD) korrigiert nach der 25%-Rally am 100-Tage-EMA, Canton (CC) steht vor dem Breakout über $0.1624 und Jupiter (JUP) stößt nach 16% in drei Tagen am 50-Tage-EMA bei $0.2174 an.
placeholder
Solana unter Druck: SOL rutscht weiter ab und steuert auf Schlüsselstütze bei $116 zuSolana (SOL) fällt am Donnerstag rund 2% und nähert sich der Schlüsselstütze bei $116; sinkendes Open Interest ($7,42 Mrd.), negative Funding Rate (-0,0042%) und Long-Liquidationen erhöhen das Risiko eines Rutsches Richtung $100 und $95.
Autor  Mitrade Team
vor 23 Stunden
Solana (SOL) fällt am Donnerstag rund 2% und nähert sich der Schlüsselstütze bei $116; sinkendes Open Interest ($7,42 Mrd.), negative Funding Rate (-0,0042%) und Long-Liquidationen erhöhen das Risiko eines Rutsches Richtung $100 und $95.
placeholder
Cardano rutscht unter $0,36: Geopolitische Spannungen belasten RisikoassetsCardano (ADA) fällt am Donnerstag unter $0,36 und handelt bei $0,35; US-Iran-Spannungen und ein Long-to-Short-Ratio von 0,71 erhöhen das Risiko eines Tests von $0,32 (31. Dezember) und darunter $0,27 (10. Oktober).
Autor  Mitrade Team
vor 23 Stunden
Cardano (ADA) fällt am Donnerstag unter $0,36 und handelt bei $0,35; US-Iran-Spannungen und ein Long-to-Short-Ratio von 0,71 erhöhen das Risiko eines Tests von $0,32 (31. Dezember) und darunter $0,27 (10. Oktober).
verbundene Finanzinstrumente
goTop
quote