


Top 3 Price Prediction Bitcoin, Ethereum, Ripple: BTC dominance drops as rotation starts slowly
- Bitcoin price is likely to suffer rejection as BTC market shows cautious optimism after halving.
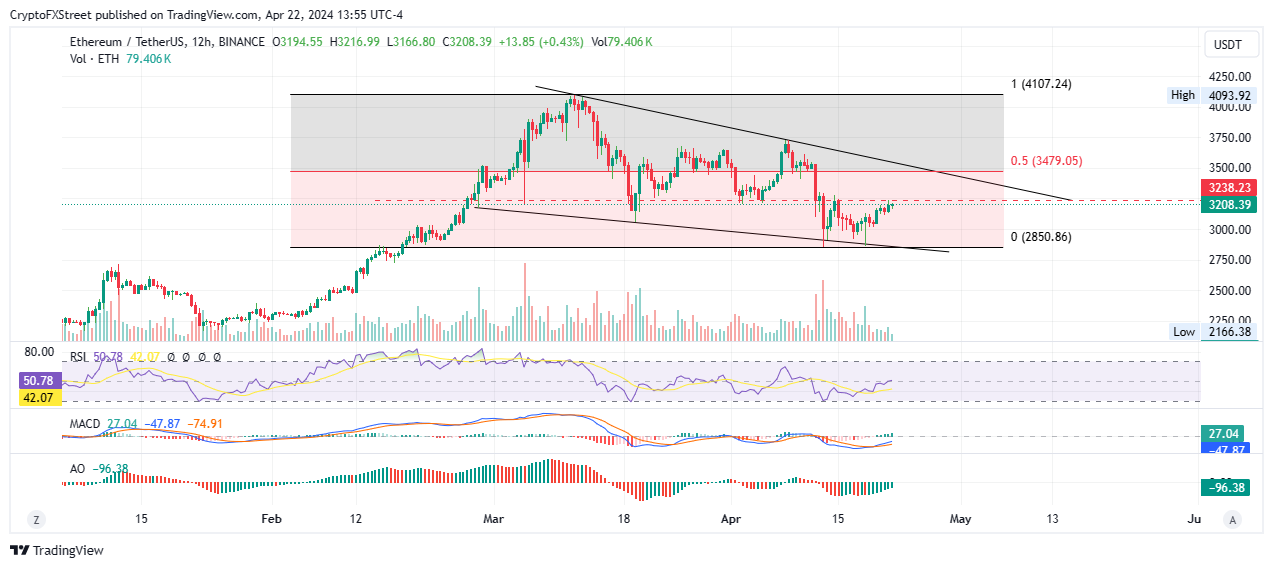
- Ethereum price making a strong close above $3,238 could kickstart a 15% rally to $3,750.
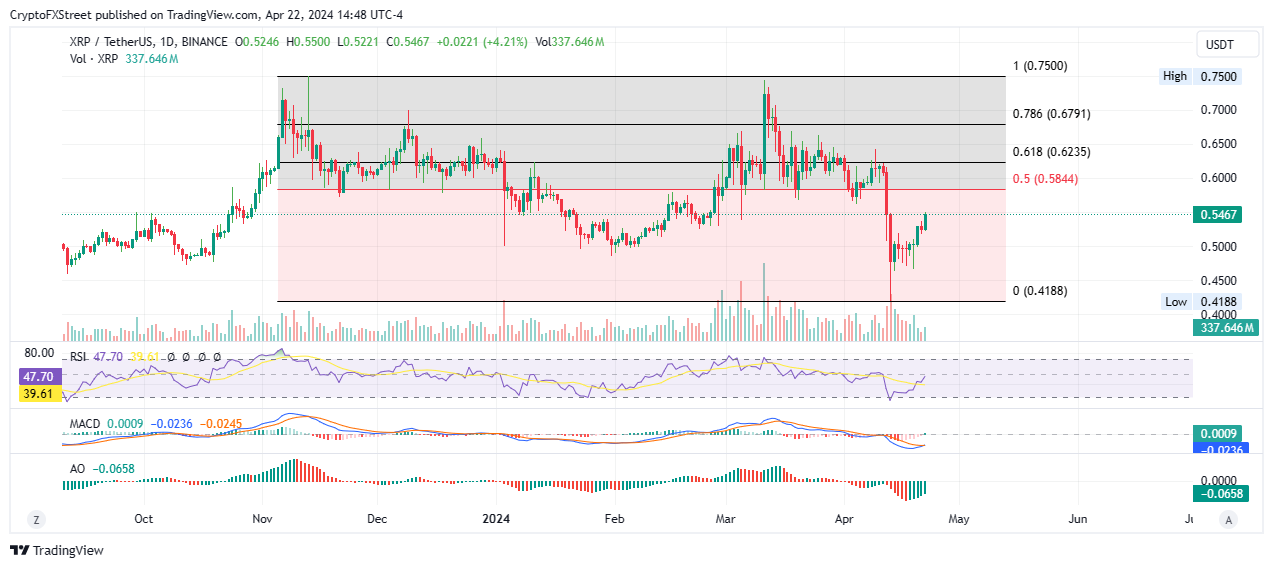
- Only a candlestick above $0.6791 would make Ripple token attractive to buy for XRP bulls.
Bitcoin (BTC) price is trading with a bullish bias following a successful halving event that has since renewed optimism in the market. With it, Ethereum (ETH) and Ripple (XRP) prices are showing promise, amid calls of a looming altcoin season.
Post-halving, markets are gathering modest gains. Meanwhile, Bitcoin dominance is going back down after establishing a peak of 57.03%. As it continues to drop, the rotation is slowly gaining steam in favor of altcoins. A drop in dominance below 54% could be a good confirmation.
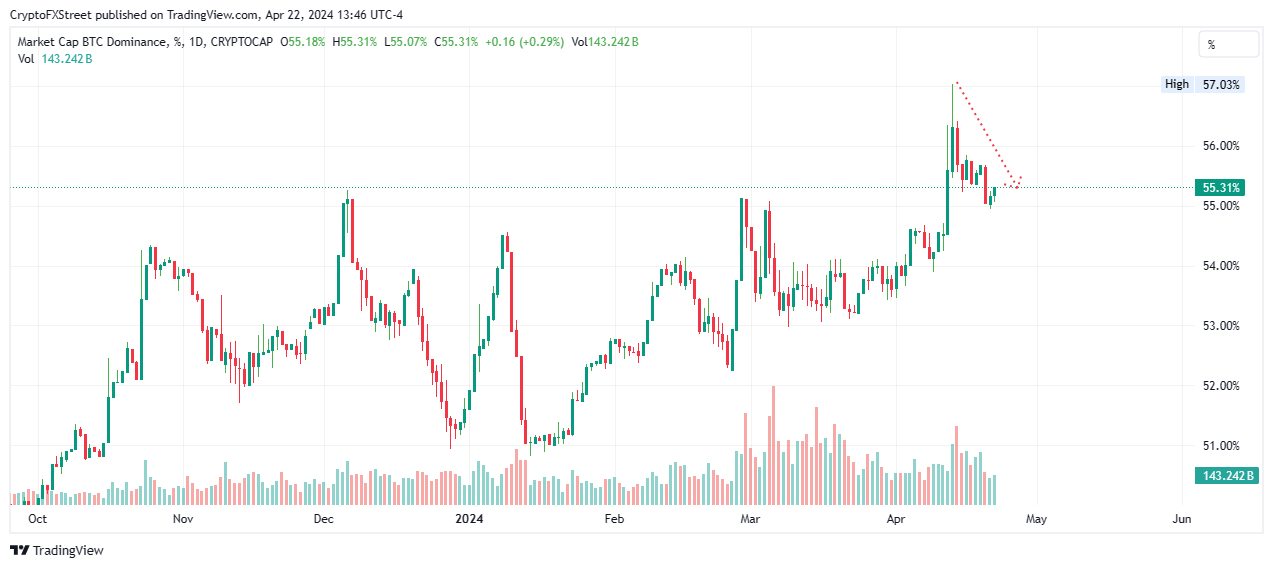
BTC dominance
Also Read: Is Bitcoin sucking liquidity from altcoins, or will alt season begin again?
Bitcoin price at the cusp of a pullback
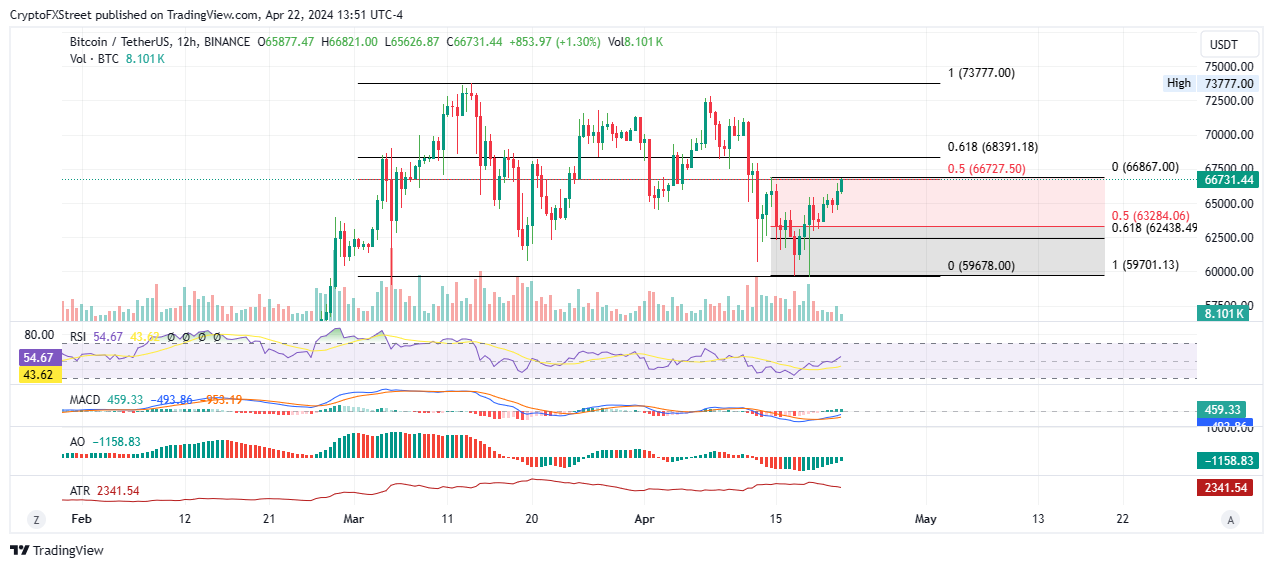
Bitcoin price is stuck within the lower section of the market range, confronting overhead pressure from the 50% Fibonacci placeholder of $66,727. The market is leaning in favor of the downside, with the Relative Strength Index (RSI) appearing subdued after spending quite some time barely above the 50 mean level and hinting at buyer exhaustion.
The Moving Average Convergence Divergence (MACD) is in negative territory. While it is above the signal line in the 12-hour time frame, the positions are reversed in the daily time frame, showing a continuation of the bearish sentiment. The Awesome Oscillator (AO) indicator in negative territory accentuates this.
Bitcoin price is likely to reverse to $63,284, followed by a subsequent drop to $60,000 before a possible pullback. Notably, there remains some uncollected liquidity below this level, marked by the March 5 low of $59,005 and whose residue needs to be collected for balance.
BTC/USDT 12-hour chart
However, if the bulls can manage to breach the $66,727 roadblock and move above the most crucial Fibonacci retracement level of 61.8% at $68,391, it could open the expanse for extended gains, potentially as high as a new peak above $73,777.
Also Read: Bitcoin price nicks $66K after halving as BTC transaction fees reverse
Ethereum price could rally 15%
Amid speculation of an altcoin season, Ethereum price could rally 15% to $3,750, levels last tested around mid-March. This could be driven by an altcoin season, with ETH bulls primed for a rally as showed by the buy signals on both the RSI and MACD indicators, which have already crossed their respective signal lines.
In a highly bullish case, the Ethereum price could extend a neck higher to $4,093, nearly 30% above current levels.
ETH/USDT 12-hour chart
Conversely, if traders succumb to their profit appetite, Ethereum price could retract 6%, losing all the gains made over the past few days. In a dire case, the slump could extend to the April 13 low of $2,850, 10% below current levels.
Also Read: Ethereum resumes consolidation after brief dip, buyback yield exceeds that of major S&P 500 companies
Ripple price must rise 25% before XRP bulls flock the scene
Ripple price is bending to the alt season narrative, but XRP bulls will only come in after the price closes above the 78.6% Fibonacci retracement level of $0.6791. With the RSI and the MACD teasing with buy signals and the AO showing a bold resolve by the bulls to recover the market after multiple successive green histograms, the upside potential for XRP continues to grow.
XRP/USDT 1-day chart
Conversely, a rejection could send the XRP price south to find initial support at the $0.5000 psychological level or lower at $0.4500. A lower low below $0.4188, however, would invalidate the bullish thesis.
Also Read: XRP Price Outlook: A breakout or significant price movement may be imminent for Ripple’s token
Cryptocurrency prices FAQs
Token launches like Arbitrum’s ARB airdrop and Optimism OP influence demand and adoption among market participants. Listings on crypto exchanges deepen the liquidity for an asset and add new participants to an asset’s network. This is typically bullish for a digital asset.
A hack is an event in which an attacker captures a large volume of the asset from a DeFi bridge or hot wallet of an exchange or any other crypto platform via exploits, bugs or other methods. The exploiter then transfers these tokens out of the exchange platforms to ultimately sell or swap the assets for other cryptocurrencies or stablecoins. Such events often involve an en masse panic triggering a sell-off in the affected assets.
Macroeconomic events like the US Federal Reserve’s decision on interest rates influence risk assets like Bitcoin, mainly through the direct impact they have on the US Dollar. An increase in interest rate typically negatively influences Bitcoin and altcoin prices, and vice versa. If the US Dollar index declines, risk assets and associated leverage for trading gets cheaper, in turn driving crypto prices higher.
Halvings are typically considered bullish events as they slash the block reward in half for miners, constricting the supply of the asset. At consistent demand if the supply reduces, the asset’s price climbs. This has been observed in Bitcoin and Litecoin.
Empfohlene Artikel


