EUR/USD gains as Fed outsize rate cut bets surge

Quelle Fxstreet
  • EUR/USD extends last week’s gains near 1.1120 as rising bets for Fed large rate cuts weigh on the US Dollar.
  • Soft US PPI and deepening concerns over labor market outlook prompt Fed jumbo rate cut bets.
  • The ECB is expected to cut interest rates once again in the last quarter of the year.

EUR/USD extends last week’s gains near 1.1120 in Monday’s European session. The major currency pair rises as growing speculation for the US Federal Reserve (Fed) to begin the policy-easing cycle aggressively on Wednesday has weighed on the US Dollar (USD). The US Dollar Index (DXY), which tracks the Greenback’s value against six major currencies, slides sharply to near 100.70.

According to the CME FedWatch tool, the probability of the Fed reducing interest rates by 50 basis points (bps) to the 4.75%-5.00% range in September has increased sharply to 61% from 30% a week ago. 

Market expectations for the Fed reducing interest rates by 50 bps have increased significantly as the United States (US) annual Producer Price Index (PPI) data for August came in sharply lower than expected on Thursday. 

The headline producer inflation rose at a slower pace of 1.7% year-over-year (YoY) from the estimates of 1.8% and July’s reading of 2.1%. Generally, a sharp slowdown in producer inflation results from growing worries over the demand outlook, which happens due to the weak purchasing power of households in a high-interest rate environment. 

Meanwhile, market experts believe that the Fed will start reducing interest rates in Wednesday’s meeting as officials are worried about deteriorating labor market conditions, with growing confidence that inflationary pressures will sustainably return to the central bank’s target of 2%.

Ahead of the Fed monetary policy decision, investors will focus on the US Retail Sales data for August, which will be published on Tuesday. Retail Sales are estimated to have grown at a slower pace of 0.2% from 1% in July.

Daily digest market movers: EUR/USD moves higher amid weakness in US Dollar

  • EUR/USD gains at the US Dollar’s expense. The Euro (EUR) exhibits a mixed performance against its major peers amid uncertainty over the European Central Bank’s (ECB) interest rate cut path. The ECB reduced its Rate on Deposit Facility again by 25 basis points (bps) to 3.50% on Thursday, as expected, but stepped back from providing a pre-defined rate-cut path.
  • ECB President Christine Lagarde said at the press conference, "The interest rate decisions will be based on its assessment of inflation outlook in light of incoming economic and financial data, dynamics of underlying inflation and strength of monetary policy transmission."
  • After the monetary policy announcement, commentaries from ECB officials have added to confidence that the bank’s battle against Eurozone inflation appears to be in the final leg. ECB Governing Council member and Bundesbank President Joachim Nagel said on Friday, "The inflation picture looks very good." Nagel added, "we are now assuming, and the data has shown, that we will reach our inflation target of 2% by the end of the next year."
  • Currently, financial market participants expect that the ECB will cut interest rates one more time in the last quarter of the year due to deepening worries over the German economic outlook. Analysts at Nomura said, “The way we think about Germany is that plentiful structural concerns – ranging from the country's greater exposure to China and the global manufacturing cycle, the energy price ‘sticker shock’ still reverberating through the economy, and poor demographic trends (falling population, a rising dependency ratio) – have lowered the bar for any given cyclical downturn to result in recession.”

Technical Analysis: EUR/USD jumps to near 1.1120

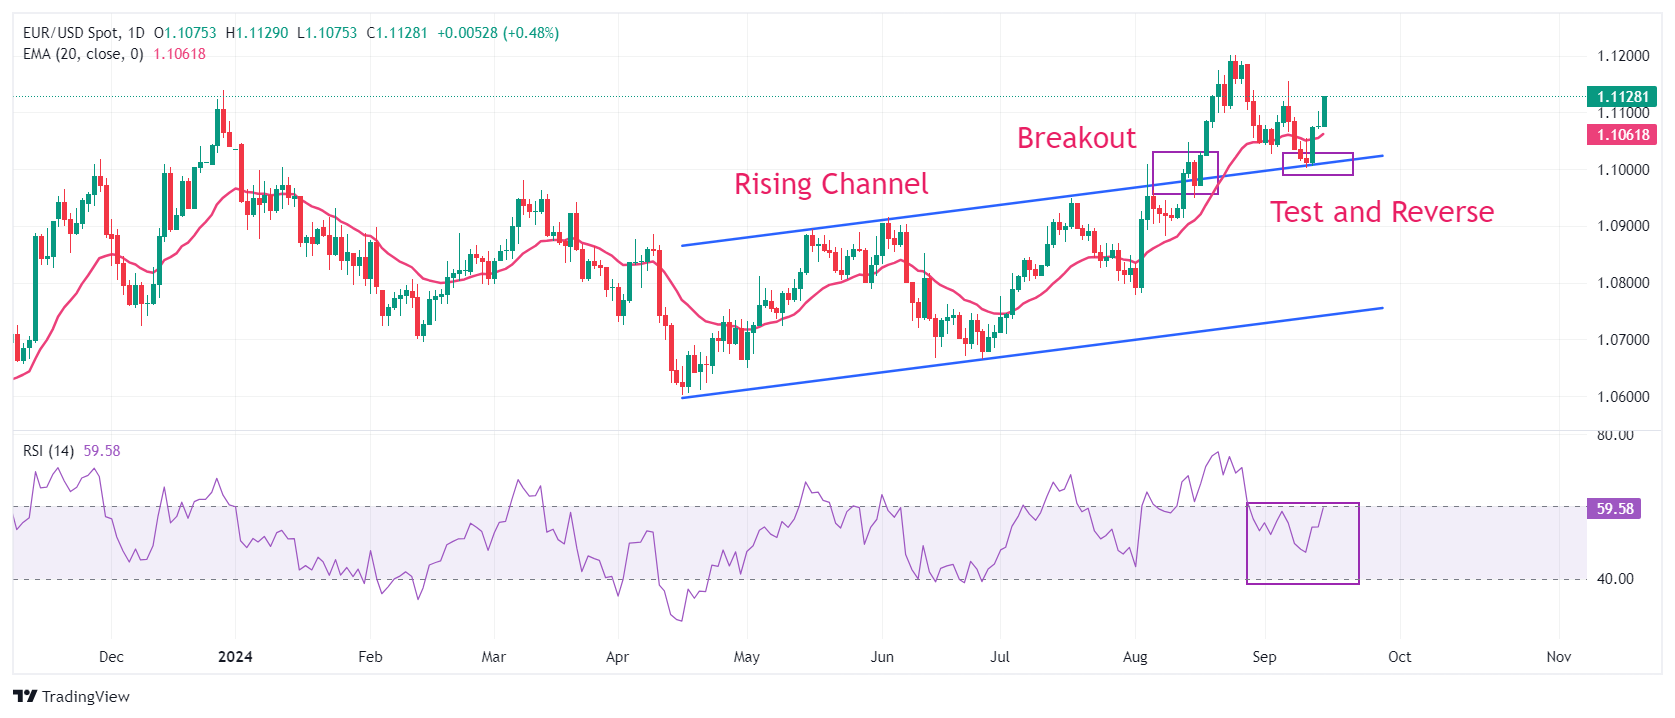
EUR/USD extends its upside to near 1.1120 on Monday. The major currency pair strengthened after retesting the breakout of the Rising Channel chart pattern formed on a daily timeframe near the psychological support of 1.1000. The near-term outlook has strengthened as the pair steadies above the 20-day Exponential Moving Average (EMA), which trades around 1.1060.

The 14-day Relative Strength Index (RSI) moves higher to near 60.00. A bullish momentum would trigger after breaking the above-mentioned level.

Looking up, last week’s high of 1.1155 and the round-level resistance of 1.1200 will act as major barricades for the Euro bulls. On the downside, the psychological level of 1.1000 and the July 17 high near 1.0950 will be major support zones.

Euro FAQs

The Euro is the currency for the 20 European Union countries that belong to the Eurozone. It is the second most heavily traded currency in the world behind the US Dollar. In 2022, it accounted for 31% of all foreign exchange transactions, with an average daily turnover of over $2.2 trillion a day. EUR/USD is the most heavily traded currency pair in the world, accounting for an estimated 30% off all transactions, followed by EUR/JPY (4%), EUR/GBP (3%) and EUR/AUD (2%).

The European Central Bank (ECB) in Frankfurt, Germany, is the reserve bank for the Eurozone. The ECB sets interest rates and manages monetary policy. The ECB’s primary mandate is to maintain price stability, which means either controlling inflation or stimulating growth. Its primary tool is the raising or lowering of interest rates. Relatively high interest rates – or the expectation of higher rates – will usually benefit the Euro and vice versa. The ECB Governing Council makes monetary policy decisions at meetings held eight times a year. Decisions are made by heads of the Eurozone national banks and six permanent members, including the President of the ECB, Christine Lagarde.

Eurozone inflation data, measured by the Harmonized Index of Consumer Prices (HICP), is an important econometric for the Euro. If inflation rises more than expected, especially if above the ECB’s 2% target, it obliges the ECB to raise interest rates to bring it back under control. Relatively high interest rates compared to its counterparts will usually benefit the Euro, as it makes the region more attractive as a place for global investors to park their money.

Data releases gauge the health of the economy and can impact on the Euro. Indicators such as GDP, Manufacturing and Services PMIs, employment, and consumer sentiment surveys can all influence the direction of the single currency. A strong economy is good for the Euro. Not only does it attract more foreign investment but it may encourage the ECB to put up interest rates, which will directly strengthen the Euro. Otherwise, if economic data is weak, the Euro is likely to fall. Economic data for the four largest economies in the euro area (Germany, France, Italy and Spain) are especially significant, as they account for 75% of the Eurozone’s economy.

Another significant data release for the Euro is the Trade Balance. This indicator measures the difference between what a country earns from its exports and what it spends on imports over a given period. If a country produces highly sought after exports then its currency will gain in value purely from the extra demand created from foreign buyers seeking to purchase these goods. Therefore, a positive net Trade Balance strengthens a currency and vice versa for a negative balance.


Haftungsausschluss: Nur zu Informationszwecken. Die bisherige Performance ist kein verlässlicher Indikator für zukünftige Ergebnisse.
placeholder
XRP wackelt erneut: Drei Signale, die den nächsten Rücksetzer auslösen könntenXRP stabilisiert sich am Montag nahe 1,90 US-Dollar nach dem Dip auf 1,81, doch sinkende XRPL-Aktivität (45.000), ein Einbruch profitabler Bestände (50,4%) und fallendes Open Interest (3,26 Mrd. USD) halten das Risiko einer Korrektur bis 1,61 US-Dollar hoch, während Widerstände bei 2,03/2,16/2,29 US-Dollar liegen.
Autor  Mitrade Team
Di. 27.Jan
XRP stabilisiert sich am Montag nahe 1,90 US-Dollar nach dem Dip auf 1,81, doch sinkende XRPL-Aktivität (45.000), ein Einbruch profitabler Bestände (50,4%) und fallendes Open Interest (3,26 Mrd. USD) halten das Risiko einer Korrektur bis 1,61 US-Dollar hoch, während Widerstände bei 2,03/2,16/2,29 US-Dollar liegen.
placeholder
Krypto-Ausblick: Bitcoin stabilisiert sich über 87.787 US-Dollar – Ether vor der nächsten Hürde, XRP bleibt fragil• Bitcoin pendelt am Mittwoch um 89.000 US-Dollar und hat sich nach der Vorwochenkorrektur bislang um knapp 3% erholt – entscheidend bleibt die Zone um 87.787 US-Dollar. • Ethereum arbeitet sich an die Widerstandszone heran: Erst ein Tagesschluss über 3.017 US-Dollar und der 50-Tage-EMA bei 3.101 US-Dollar würde den Weg nach oben freimachen. • XRP prallt von 1,83 US-Dollar ab und steht wieder bei 1,90 US-Dollar – doch RSI und MACD sprechen weiter für Vorsicht. Nach der kräftigen Korrektur der vergangenen Woche setzt sich im Kryptomarkt eine vorsichtige Stabilisierung durch. Bitcoin, Ether und XRP bauen ihre Erholung aus, stoßen nun aber auf charttechnisch wichtige Marken, an denen sich entscheidet, ob aus der Gegenbewegung mehr wird – oder ob der nächste Rücksetzer folgt. Bitcoin: 87.787 US-Dollar bleibt der Dreh- und Angelpunkt Bitcoin hat am Montag nach der 7,48%-Korrektur der Vorwoche wieder oberhalb der Mittellinie eines horizontalen Parallelkanals bei 87.787 US-Dollar geschlossen. Am Dienstag verteidigte der Kurs diese Zone erneut, am Mittwoch notiert BTC bei rund 89.300 US-Dollar. Hält 87.787 US-Dollar als Support, rückt die obere Begrenzung des Musters bei 90.000 US-Dollar in den Fokus. Der RSI (Tag) liegt bei 45 und steigt in Richtung der neutralen 50 – ein Hinweis auf nachlassenden Verkaufsdruck. Auch der MACD entspannt sich: Die Linien nähern sich an, die roten Histogrammbalken unterhalb der Nulllinie werden schwächer. Bricht Bitcoin dagegen per Tagesschluss wieder unter 87.787 US-Dollar, bleibt die Unterseite anfällig – dann würde die nächste Auffangzone bei 85.569 US-Dollar (zugleich 78,6% Fibonacci-Retracement) wieder relevant. Ethereum: Erst über 3.017 und 3.101 US-Dollar wird es konstruktiver Ethereum startete positiv in die Woche und legte bis Dienstag um 7,62% zu – nach der 14,22%-Korrektur in der Woche davor. Am Mittwoch nähert sich ETH dem zentralen Widerstand bei 3.017 US-Dollar. Für ein klareres Erholungssignal braucht es mehr als nur Intraday-Stärke: Ein Ausbruch über 3.017 US-Dollar und ein Tagesschluss über dem 50-Tage-EMA bei 3.101 US-Dollar könnten den Blick in Richtung des Hochs vom 14. Januar bei 3.402 US-Dollar lenken. Die Momentum-Indikatoren (RSI und MACD) deuten zwar auf nachlassenden Abwärtsdruck hin, aber das Setup bleibt empfindlich. Kommt es stattdessen zu einer erneuten Abweisung an der Widerstandszone, rückt auf der Unterseite das 61,8% Fibonacci-Retracement bei 2.749 US-Dollar wieder ins Blickfeld. XRP: Rebound ja – Trendwende noch nicht XRP hat am Sonntag die tägliche Unterstützung bei 1,83 US-Dollar getestet und anschließend binnen zwei Tagen um 4,51% zugelegt. Am Mittwoch handelt der Kurs bei 1,90 US-Dollar. Solange 1,83 US-Dollar hält, kann sich die Erholung in Richtung des nächsten Widerstands bei 1,96 US-Dollar fortsetzen. Allerdings ist der Unterton noch nicht gedreht: Der RSI liegt bei 42 und damit weiter unter der neutralen 50. Zudem bleibt das Bild im MACD belastet – das bärische Crossover der Vorwoche ist weiterhin aktiv, was das Rückschlagrisiko erhöht. Fällt XRP per Tagesschluss erneut unter 1,83 US-Dollar, wäre ein weiterer Abwärtsimpuls bis zum Tief vom 19. Dezember bei 1,77 US-Dollar wieder ein realistisches Szenario.
Autor  Mitrade Team
Mi. 28.Jan
• Bitcoin pendelt am Mittwoch um 89.000 US-Dollar und hat sich nach der Vorwochenkorrektur bislang um knapp 3% erholt – entscheidend bleibt die Zone um 87.787 US-Dollar. • Ethereum arbeitet sich an die Widerstandszone heran: Erst ein Tagesschluss über 3.017 US-Dollar und der 50-Tage-EMA bei 3.101 US-Dollar würde den Weg nach oben freimachen. • XRP prallt von 1,83 US-Dollar ab und steht wieder bei 1,90 US-Dollar – doch RSI und MACD sprechen weiter für Vorsicht. Nach der kräftigen Korrektur der vergangenen Woche setzt sich im Kryptomarkt eine vorsichtige Stabilisierung durch. Bitcoin, Ether und XRP bauen ihre Erholung aus, stoßen nun aber auf charttechnisch wichtige Marken, an denen sich entscheidet, ob aus der Gegenbewegung mehr wird – oder ob der nächste Rücksetzer folgt. Bitcoin: 87.787 US-Dollar bleibt der Dreh- und Angelpunkt Bitcoin hat am Montag nach der 7,48%-Korrektur der Vorwoche wieder oberhalb der Mittellinie eines horizontalen Parallelkanals bei 87.787 US-Dollar geschlossen. Am Dienstag verteidigte der Kurs diese Zone erneut, am Mittwoch notiert BTC bei rund 89.300 US-Dollar. Hält 87.787 US-Dollar als Support, rückt die obere Begrenzung des Musters bei 90.000 US-Dollar in den Fokus. Der RSI (Tag) liegt bei 45 und steigt in Richtung der neutralen 50 – ein Hinweis auf nachlassenden Verkaufsdruck. Auch der MACD entspannt sich: Die Linien nähern sich an, die roten Histogrammbalken unterhalb der Nulllinie werden schwächer. Bricht Bitcoin dagegen per Tagesschluss wieder unter 87.787 US-Dollar, bleibt die Unterseite anfällig – dann würde die nächste Auffangzone bei 85.569 US-Dollar (zugleich 78,6% Fibonacci-Retracement) wieder relevant. Ethereum: Erst über 3.017 und 3.101 US-Dollar wird es konstruktiver Ethereum startete positiv in die Woche und legte bis Dienstag um 7,62% zu – nach der 14,22%-Korrektur in der Woche davor. Am Mittwoch nähert sich ETH dem zentralen Widerstand bei 3.017 US-Dollar. Für ein klareres Erholungssignal braucht es mehr als nur Intraday-Stärke: Ein Ausbruch über 3.017 US-Dollar und ein Tagesschluss über dem 50-Tage-EMA bei 3.101 US-Dollar könnten den Blick in Richtung des Hochs vom 14. Januar bei 3.402 US-Dollar lenken. Die Momentum-Indikatoren (RSI und MACD) deuten zwar auf nachlassenden Abwärtsdruck hin, aber das Setup bleibt empfindlich. Kommt es stattdessen zu einer erneuten Abweisung an der Widerstandszone, rückt auf der Unterseite das 61,8% Fibonacci-Retracement bei 2.749 US-Dollar wieder ins Blickfeld. XRP: Rebound ja – Trendwende noch nicht XRP hat am Sonntag die tägliche Unterstützung bei 1,83 US-Dollar getestet und anschließend binnen zwei Tagen um 4,51% zugelegt. Am Mittwoch handelt der Kurs bei 1,90 US-Dollar. Solange 1,83 US-Dollar hält, kann sich die Erholung in Richtung des nächsten Widerstands bei 1,96 US-Dollar fortsetzen. Allerdings ist der Unterton noch nicht gedreht: Der RSI liegt bei 42 und damit weiter unter der neutralen 50. Zudem bleibt das Bild im MACD belastet – das bärische Crossover der Vorwoche ist weiterhin aktiv, was das Rückschlagrisiko erhöht. Fällt XRP per Tagesschluss erneut unter 1,83 US-Dollar, wäre ein weiterer Abwärtsimpuls bis zum Tief vom 19. Dezember bei 1,77 US-Dollar wieder ein realistisches Szenario.
placeholder
Solana unter Druck: SOL rutscht weiter ab und steuert auf Schlüsselstütze bei $116 zuSolana (SOL) fällt am Donnerstag rund 2% und nähert sich der Schlüsselstütze bei $116; sinkendes Open Interest ($7,42 Mrd.), negative Funding Rate (-0,0042%) und Long-Liquidationen erhöhen das Risiko eines Rutsches Richtung $100 und $95.
Autor  Mitrade Team
Do. 29.Jan
Solana (SOL) fällt am Donnerstag rund 2% und nähert sich der Schlüsselstütze bei $116; sinkendes Open Interest ($7,42 Mrd.), negative Funding Rate (-0,0042%) und Long-Liquidationen erhöhen das Risiko eines Rutsches Richtung $100 und $95.
placeholder
Cardano rutscht unter $0,36: Geopolitische Spannungen belasten RisikoassetsCardano (ADA) fällt am Donnerstag unter $0,36 und handelt bei $0,35; US-Iran-Spannungen und ein Long-to-Short-Ratio von 0,71 erhöhen das Risiko eines Tests von $0,32 (31. Dezember) und darunter $0,27 (10. Oktober).
Autor  Mitrade Team
Do. 29.Jan
Cardano (ADA) fällt am Donnerstag unter $0,36 und handelt bei $0,35; US-Iran-Spannungen und ein Long-to-Short-Ratio von 0,71 erhöhen das Risiko eines Tests von $0,32 (31. Dezember) und darunter $0,27 (10. Oktober).
placeholder
Gold fällt, da die Einigung über die Regierungsfinanzierung den USD stärkt und Gewinnmitnahmen auslöstGold (XAU/USD) erlebt am Freitag zum zweiten Mal in Folge eine starke Liquidation, nachdem es seit Beginn dieses Monats um mehr als 25% parabolisch gestiegen ist und in den letzten zwei Wochen eine Reihe von Rekordhochs erreicht hat.
Autor  FXStreet
Fr. 30.Jan
Gold (XAU/USD) erlebt am Freitag zum zweiten Mal in Folge eine starke Liquidation, nachdem es seit Beginn dieses Monats um mehr als 25% parabolisch gestiegen ist und in den letzten zwei Wochen eine Reihe von Rekordhochs erreicht hat.
verbundene Finanzinstrumente
goTop
quote