Mexican Peso snaps losing streak to rise on soft US data

Quelle Fxstreet
  • Mexican Peso recovers slightly, breaking three-day losing streak.
  • Mexico's wider April trade deficit and slower economic growth are reported by INEGI.
  • Banxico minutes show division on rate cuts amid ongoing inflation, emphasizing commitment to price stability.
  • US Durable Goods Orders beat expectations, but March's figures are revised down heavily.

The Mexican Peso snapped three days of losses and climbed more than 0.10% against the US Dollar on Friday amid an improvement in risk appetite and softer-than-expected US data that weighed on the Greenback. At the time of writing, the USD/MXN trades at 16.69, down 0.17%.

Mexico’s National Statistics Agency (INEGI) revealed a wider-than-expected trade deficit in April. On Thursday, INEGI announced that the economy grew at a slower pace than foreseen, while inflation for the Mid-month was mixed.

The Bank of Mexico featured its last monetary policy meeting minutes, which revealed the Governing Council is divided over when to resume interest rate cuts amid stubbornly stickier inflation. At the latest meeting, Banxico upwardly revised inflation and mentioned that it remains committed to price stability.

Across the border, the US Department of Commerce revealed that Durable Goods Orders exceeded expectations but revised March’s figures downward from 2.4% to 0.8%. Recently, a survey showed that consumer sentiment shifted to slightly pessimistic, according to a University of Michigan Survey. The same poll revealed that inflation expectations are tilted to the downside.

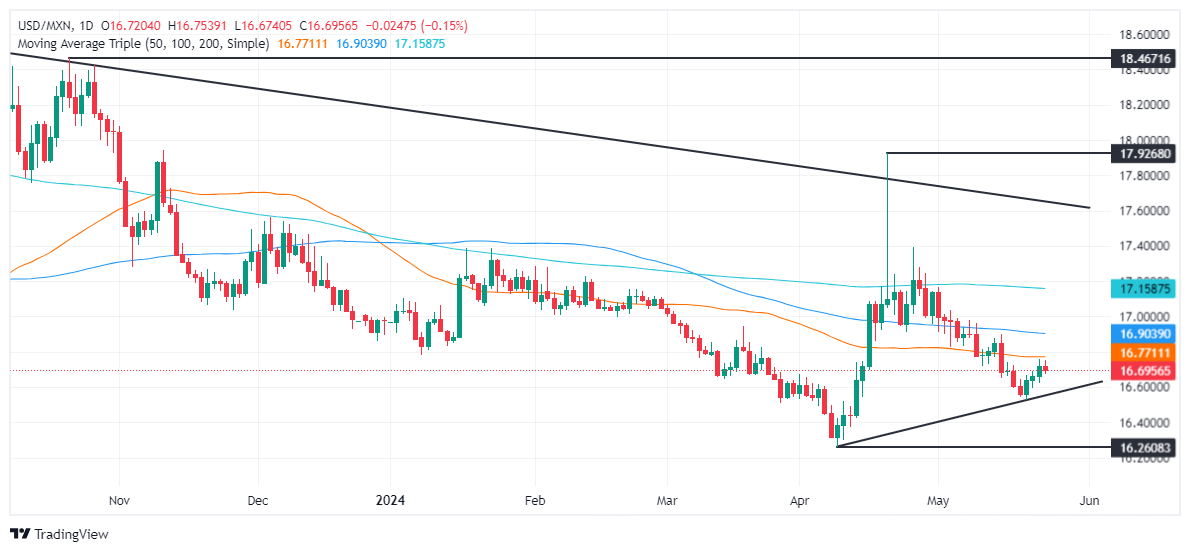
Given the fundamental backdrop, the USD/MXN resumed its downtrend as buyers struggled to breach strong resistance at the 100-day Simple Moving Average (SMA) at 16.76, opening the door for a retracement.

Daily digest market movers: Mexican Peso leans on soft US data to appreciate against USD

  • Mexico’s Balance of Trade in April was $-3.746 billion, exceeding forecasts of $-0.8 billion and March’s $2.09 billion surplus.
  • Mexico’s economy is slowing as expected as Gross Domestic Product for Q1 2024 grew 1.6% YoY, aligned with estimates but trailing 2023’a last quarter rate of 2.5%.
  • Mid-month headline inflation rose from 4.63% to 4.78%, but the core continued to aim lower. Underlying inflation for the same period stood at 4.31% YoY, down from 4.39%.
  • May’s Citibanamex poll showed that most economists estimate Banxico will cut rates on June 27 from 11% to 10.75%. The median expects headline inflation at 4.21% and core at 4.07% in 2024.
  • April’s US Durable Goods Orders increased by 0.7% MoM, exceeding estimates of -0.8% contraction but lower than the downwardly revised March figures.
  • The UoM Consumer Sentiment Index in May was 69.1, below April’s 77.2, but exceeded forecasts of 67.5. Inflation Expectations for one year stood at 3.3%, up from 3.2%. For a five-year period, they were unchanged at 3%.
  • Despite that, fed funds rate futures estimated just 26 basis points of easing toward the end of the year after S&P Global revealed that US business activity is gathering steam.

Technical analysis: Mexican Peso counter attacks as USD/MXN tumbles below 16.70

The USD/MXN downtrend extended after buyers were unable to cancel the 100-day SMA at 16.76. The exotic pair retreated afterward, down some 365 pips and back below the psychological 16.70 mark. Momentum is on the sellers’ side as the Relative Strength Index (RSI) aims downward in bearish territory.

Due to seller strength, the path of least resistance is downward. The pair would meet its next support at 16.62, the 2023 low, followed by the May 21 cycle low at 16.52 and the year-to-date low of 16.25.

Conversely, if buyers reclaim 16.70, they must clear the 100-day SMA at 16.76 before extending its gains. In that outcome, key resistance levels emerge like the 50-day SMA at 16.89, the 17.00 psychological figure and the 200-day SMA at 17.15.

Mexican Peso FAQs

The Mexican Peso (MXN) is the most traded currency among its Latin American peers. Its value is broadly determined by the performance of the Mexican economy, the country’s central bank’s policy, the amount of foreign investment in the country and even the levels of remittances sent by Mexicans who live abroad, particularly in the United States. Geopolitical trends can also move MXN: for example, the process of nearshoring – or the decision by some firms to relocate manufacturing capacity and supply chains closer to their home countries – is also seen as a catalyst for the Mexican currency as the country is considered a key manufacturing hub in the American continent. Another catalyst for MXN is Oil prices as Mexico is a key exporter of the commodity.

The main objective of Mexico’s central bank, also known as Banxico, is to maintain inflation at low and stable levels (at or close to its target of 3%, the midpoint in a tolerance band of between 2% and 4%). To this end, the bank sets an appropriate level of interest rates. When inflation is too high, Banxico will attempt to tame it by raising interest rates, making it more expensive for households and businesses to borrow money, thus cooling demand and the overall economy. Higher interest rates are generally positive for the Mexican Peso (MXN) as they lead to higher yields, making the country a more attractive place for investors. On the contrary, lower interest rates tend to weaken MXN.

Macroeconomic data releases are key to assess the state of the economy and can have an impact on the Mexican Peso (MXN) valuation. A strong Mexican economy, based on high economic growth, low unemployment and high confidence is good for MXN. Not only does it attract more foreign investment but it may encourage the Bank of Mexico (Banxico) to increase interest rates, particularly if this strength comes together with elevated inflation. However, if economic data is weak, MXN is likely to depreciate.

As an emerging-market currency, the Mexican Peso (MXN) tends to strive during risk-on periods, or when investors perceive that broader market risks are low and thus are eager to engage with investments that carry a higher risk. Conversely, MXN tends to weaken at times of market turbulence or economic uncertainty as investors tend to sell higher-risk assets and flee to the more-stable safe havens.


Haftungsausschluss: Nur zu Informationszwecken. Die bisherige Performance ist kein verlässlicher Indikator für zukünftige Ergebnisse.
placeholder
Silberpreis-Prognose: XAG/USD erholt sich in Richtung 95,00 US-Dollar nahe RekordhöhenDer Silberpreis (XAG/USD) gleicht die Verluste der beiden vorhergehenden Tage aus und handelt während der europäischen Handelsstunden am Donnerstag um die 94,20 USD je Feinunze.
Autor  FXStreet
Do. 22.Jan
Der Silberpreis (XAG/USD) gleicht die Verluste der beiden vorhergehenden Tage aus und handelt während der europäischen Handelsstunden am Donnerstag um die 94,20 USD je Feinunze.
placeholder
Gold setzt Rekord-Rally fort – XAU/USD nähert sich $5,100 mit schwachem USD und anhaltender Safe-Haven-NachfrageGold (XAU/USD) setzt seine Rekord-Rally fort und nähert sich der Marke von $5,100, gestützt von geopolitischen Spannungen, schwachem USD und Zinssenkungserwartungen der Fed; technische Hürden bei $5,099 und Konsolidierungspotenzial bei $4,932.
Autor  Mitrade Team
Mo. 26.Jan
Gold (XAU/USD) setzt seine Rekord-Rally fort und nähert sich der Marke von $5,100, gestützt von geopolitischen Spannungen, schwachem USD und Zinssenkungserwartungen der Fed; technische Hürden bei $5,099 und Konsolidierungspotenzial bei $4,932.
placeholder
Silber nach Rekordlauf leicht zurück: XAG/USD bleibt bullish, aber Momentum ist überdehntSilber (XAG/USD) erreicht am Montag ein Rekordhoch bei $109.46 und konsolidiert um $108.80, während der Aufwärtskanal und die Spreizung zwischen 9- und 50-Tage-EMA den Trend stützen, der überkaufte RSI 80.24 jedoch eine kurzfristige Pause wahrscheinlicher macht.
Autor  Mitrade Team
Mo. 26.Jan
Silber (XAG/USD) erreicht am Montag ein Rekordhoch bei $109.46 und konsolidiert um $108.80, während der Aufwärtskanal und die Spreizung zwischen 9- und 50-Tage-EMA den Trend stützen, der überkaufte RSI 80.24 jedoch eine kurzfristige Pause wahrscheinlicher macht.
placeholder
Gold hält sich über 5.150 US-Dollar – Anleger warten auf Fed-EntscheidGold (XAU/USD) hält sich vor der Fed-Entscheidung am Mittwoch über 5.150 US-Dollar und steigt in Asien bis nahe 5.160 US-Dollar, gestützt von Dollar-Schwäche, geopolitischen Risiken und der Erwartung einer Zinspause bei 3,50% bis 3,75%.
Autor  Mitrade Team
Gestern 01: 01
Gold (XAU/USD) hält sich vor der Fed-Entscheidung am Mittwoch über 5.150 US-Dollar und steigt in Asien bis nahe 5.160 US-Dollar, gestützt von Dollar-Schwäche, geopolitischen Risiken und der Erwartung einer Zinspause bei 3,50% bis 3,75%.
placeholder
Krypto-Ausblick: Bitcoin stabilisiert sich über 87.787 US-Dollar – Ether vor der nächsten Hürde, XRP bleibt fragil• Bitcoin pendelt am Mittwoch um 89.000 US-Dollar und hat sich nach der Vorwochenkorrektur bislang um knapp 3% erholt – entscheidend bleibt die Zone um 87.787 US-Dollar. • Ethereum arbeitet sich an die Widerstandszone heran: Erst ein Tagesschluss über 3.017 US-Dollar und der 50-Tage-EMA bei 3.101 US-Dollar würde den Weg nach oben freimachen. • XRP prallt von 1,83 US-Dollar ab und steht wieder bei 1,90 US-Dollar – doch RSI und MACD sprechen weiter für Vorsicht. Nach der kräftigen Korrektur der vergangenen Woche setzt sich im Kryptomarkt eine vorsichtige Stabilisierung durch. Bitcoin, Ether und XRP bauen ihre Erholung aus, stoßen nun aber auf charttechnisch wichtige Marken, an denen sich entscheidet, ob aus der Gegenbewegung mehr wird – oder ob der nächste Rücksetzer folgt. Bitcoin: 87.787 US-Dollar bleibt der Dreh- und Angelpunkt Bitcoin hat am Montag nach der 7,48%-Korrektur der Vorwoche wieder oberhalb der Mittellinie eines horizontalen Parallelkanals bei 87.787 US-Dollar geschlossen. Am Dienstag verteidigte der Kurs diese Zone erneut, am Mittwoch notiert BTC bei rund 89.300 US-Dollar. Hält 87.787 US-Dollar als Support, rückt die obere Begrenzung des Musters bei 90.000 US-Dollar in den Fokus. Der RSI (Tag) liegt bei 45 und steigt in Richtung der neutralen 50 – ein Hinweis auf nachlassenden Verkaufsdruck. Auch der MACD entspannt sich: Die Linien nähern sich an, die roten Histogrammbalken unterhalb der Nulllinie werden schwächer. Bricht Bitcoin dagegen per Tagesschluss wieder unter 87.787 US-Dollar, bleibt die Unterseite anfällig – dann würde die nächste Auffangzone bei 85.569 US-Dollar (zugleich 78,6% Fibonacci-Retracement) wieder relevant. Ethereum: Erst über 3.017 und 3.101 US-Dollar wird es konstruktiver Ethereum startete positiv in die Woche und legte bis Dienstag um 7,62% zu – nach der 14,22%-Korrektur in der Woche davor. Am Mittwoch nähert sich ETH dem zentralen Widerstand bei 3.017 US-Dollar. Für ein klareres Erholungssignal braucht es mehr als nur Intraday-Stärke: Ein Ausbruch über 3.017 US-Dollar und ein Tagesschluss über dem 50-Tage-EMA bei 3.101 US-Dollar könnten den Blick in Richtung des Hochs vom 14. Januar bei 3.402 US-Dollar lenken. Die Momentum-Indikatoren (RSI und MACD) deuten zwar auf nachlassenden Abwärtsdruck hin, aber das Setup bleibt empfindlich. Kommt es stattdessen zu einer erneuten Abweisung an der Widerstandszone, rückt auf der Unterseite das 61,8% Fibonacci-Retracement bei 2.749 US-Dollar wieder ins Blickfeld. XRP: Rebound ja – Trendwende noch nicht XRP hat am Sonntag die tägliche Unterstützung bei 1,83 US-Dollar getestet und anschließend binnen zwei Tagen um 4,51% zugelegt. Am Mittwoch handelt der Kurs bei 1,90 US-Dollar. Solange 1,83 US-Dollar hält, kann sich die Erholung in Richtung des nächsten Widerstands bei 1,96 US-Dollar fortsetzen. Allerdings ist der Unterton noch nicht gedreht: Der RSI liegt bei 42 und damit weiter unter der neutralen 50. Zudem bleibt das Bild im MACD belastet – das bärische Crossover der Vorwoche ist weiterhin aktiv, was das Rückschlagrisiko erhöht. Fällt XRP per Tagesschluss erneut unter 1,83 US-Dollar, wäre ein weiterer Abwärtsimpuls bis zum Tief vom 19. Dezember bei 1,77 US-Dollar wieder ein realistisches Szenario.
Autor  Mitrade Team
Gestern 06: 37
• Bitcoin pendelt am Mittwoch um 89.000 US-Dollar und hat sich nach der Vorwochenkorrektur bislang um knapp 3% erholt – entscheidend bleibt die Zone um 87.787 US-Dollar. • Ethereum arbeitet sich an die Widerstandszone heran: Erst ein Tagesschluss über 3.017 US-Dollar und der 50-Tage-EMA bei 3.101 US-Dollar würde den Weg nach oben freimachen. • XRP prallt von 1,83 US-Dollar ab und steht wieder bei 1,90 US-Dollar – doch RSI und MACD sprechen weiter für Vorsicht. Nach der kräftigen Korrektur der vergangenen Woche setzt sich im Kryptomarkt eine vorsichtige Stabilisierung durch. Bitcoin, Ether und XRP bauen ihre Erholung aus, stoßen nun aber auf charttechnisch wichtige Marken, an denen sich entscheidet, ob aus der Gegenbewegung mehr wird – oder ob der nächste Rücksetzer folgt. Bitcoin: 87.787 US-Dollar bleibt der Dreh- und Angelpunkt Bitcoin hat am Montag nach der 7,48%-Korrektur der Vorwoche wieder oberhalb der Mittellinie eines horizontalen Parallelkanals bei 87.787 US-Dollar geschlossen. Am Dienstag verteidigte der Kurs diese Zone erneut, am Mittwoch notiert BTC bei rund 89.300 US-Dollar. Hält 87.787 US-Dollar als Support, rückt die obere Begrenzung des Musters bei 90.000 US-Dollar in den Fokus. Der RSI (Tag) liegt bei 45 und steigt in Richtung der neutralen 50 – ein Hinweis auf nachlassenden Verkaufsdruck. Auch der MACD entspannt sich: Die Linien nähern sich an, die roten Histogrammbalken unterhalb der Nulllinie werden schwächer. Bricht Bitcoin dagegen per Tagesschluss wieder unter 87.787 US-Dollar, bleibt die Unterseite anfällig – dann würde die nächste Auffangzone bei 85.569 US-Dollar (zugleich 78,6% Fibonacci-Retracement) wieder relevant. Ethereum: Erst über 3.017 und 3.101 US-Dollar wird es konstruktiver Ethereum startete positiv in die Woche und legte bis Dienstag um 7,62% zu – nach der 14,22%-Korrektur in der Woche davor. Am Mittwoch nähert sich ETH dem zentralen Widerstand bei 3.017 US-Dollar. Für ein klareres Erholungssignal braucht es mehr als nur Intraday-Stärke: Ein Ausbruch über 3.017 US-Dollar und ein Tagesschluss über dem 50-Tage-EMA bei 3.101 US-Dollar könnten den Blick in Richtung des Hochs vom 14. Januar bei 3.402 US-Dollar lenken. Die Momentum-Indikatoren (RSI und MACD) deuten zwar auf nachlassenden Abwärtsdruck hin, aber das Setup bleibt empfindlich. Kommt es stattdessen zu einer erneuten Abweisung an der Widerstandszone, rückt auf der Unterseite das 61,8% Fibonacci-Retracement bei 2.749 US-Dollar wieder ins Blickfeld. XRP: Rebound ja – Trendwende noch nicht XRP hat am Sonntag die tägliche Unterstützung bei 1,83 US-Dollar getestet und anschließend binnen zwei Tagen um 4,51% zugelegt. Am Mittwoch handelt der Kurs bei 1,90 US-Dollar. Solange 1,83 US-Dollar hält, kann sich die Erholung in Richtung des nächsten Widerstands bei 1,96 US-Dollar fortsetzen. Allerdings ist der Unterton noch nicht gedreht: Der RSI liegt bei 42 und damit weiter unter der neutralen 50. Zudem bleibt das Bild im MACD belastet – das bärische Crossover der Vorwoche ist weiterhin aktiv, was das Rückschlagrisiko erhöht. Fällt XRP per Tagesschluss erneut unter 1,83 US-Dollar, wäre ein weiterer Abwärtsimpuls bis zum Tief vom 19. Dezember bei 1,77 US-Dollar wieder ein realistisches Szenario.
verbundene Finanzinstrumente
goTop
quote