

Oil rally eases ahead of $77.00 as trades digest concerns over Libya supply
- Oil undergoes some light profit-taking after rallying above $77.00 on Monday.
- Analysts are issuing concerns about supply after the sudden disruption of Libyan barrels in the markets.
- The US Dollar Index trades back below 101.00 as its recovery eases already.
Oil traders appear to be taking profits on Tuesday after prices have been undergoing a very steep three-day surge which retraced ahead of a pivotal technical area near $77.60. Markets are digesting the sudden disruption in Libyan Oil production in a political local spat between the Benghazi government and the officially-recognised government seating in Tripoli over who should become the next Chairman at the central bank. Analysts said that Libya's supply outage could not easily be replaced as it concerns Light Sweet Crude, which is very high in demand because it can more easily be fractionated into gasoline or kerosene.
The US Dollar Index (DXY) is meanwhile undergoing some profit-taking as well after its recovery only lasted one day. Markets are still going all in on substantial interest-rate cuts from the US Federal Reserve (Fed). In this scenario, the biggest risk is that strong incoming US data might ease or even scrub future rate cuts in case the US economy overheats again.
At the time of writing, Crude Oil (WTI) trades at $76.48 and Brent Crude at $79.21.
Oil news and market movers: Libya’s outage means issues for refiners
- Marketwire reports that several analysts are seeing severe issues with the sudden shutdown of Libyan Oil fields as they produce Light Sweet Crude, which is in high demand on the markets.
- Recent Chinese data reveals that Chinese Crude refiners are struggling with far less demand as sales of Electric Vehicles (EVs) are booming in China. The sector is already on the back foot due to a slowdown in demand from the manufacturing and construction sectors, a Bloomberg report showed this Tuesday.
- Goldman Sachs joins Morgan Stanley and cuts its Brent forecast to $77.00 per barrel by 2025 as OPEC is probably heading to reverse its voluntary supply cuts.
- The American Petroleum Institute will release at 20:30 GMT its weekly crude Oil stock numbers for the week ending August 23. Analysts expect a drawdown of 3 million barrels.
Oil Technical Analysis: Technical issues ahead
Oil has sprinted higher to a technical junction residing near $77.60. From that level on, towards $79.00 almost four different resistances will limit Oil prices. The trifecta of Simple Moving Averages (SMA) and the descending trendline should do the trick in keeping price action muted at current levels. With the downward revisions from Goldman Sachs and Morgan Stanley, this could be the end of the line for Crude’s recent rally.
On the upside, the double level at $77.65 aligns with both a descending trendline and the 200-day Simple Moving Average (SMA). In case bulls are able to break above it, the 100-day SMA at $78.45 could trigger a rejection.
On the downside, the low from August 5 at $71.17 emerges as the first support. Under $70.00, the $68.00 big figure is the first level to watch followed by $67.11, which is the lowest point from the triple bottom seen back in June 2023.
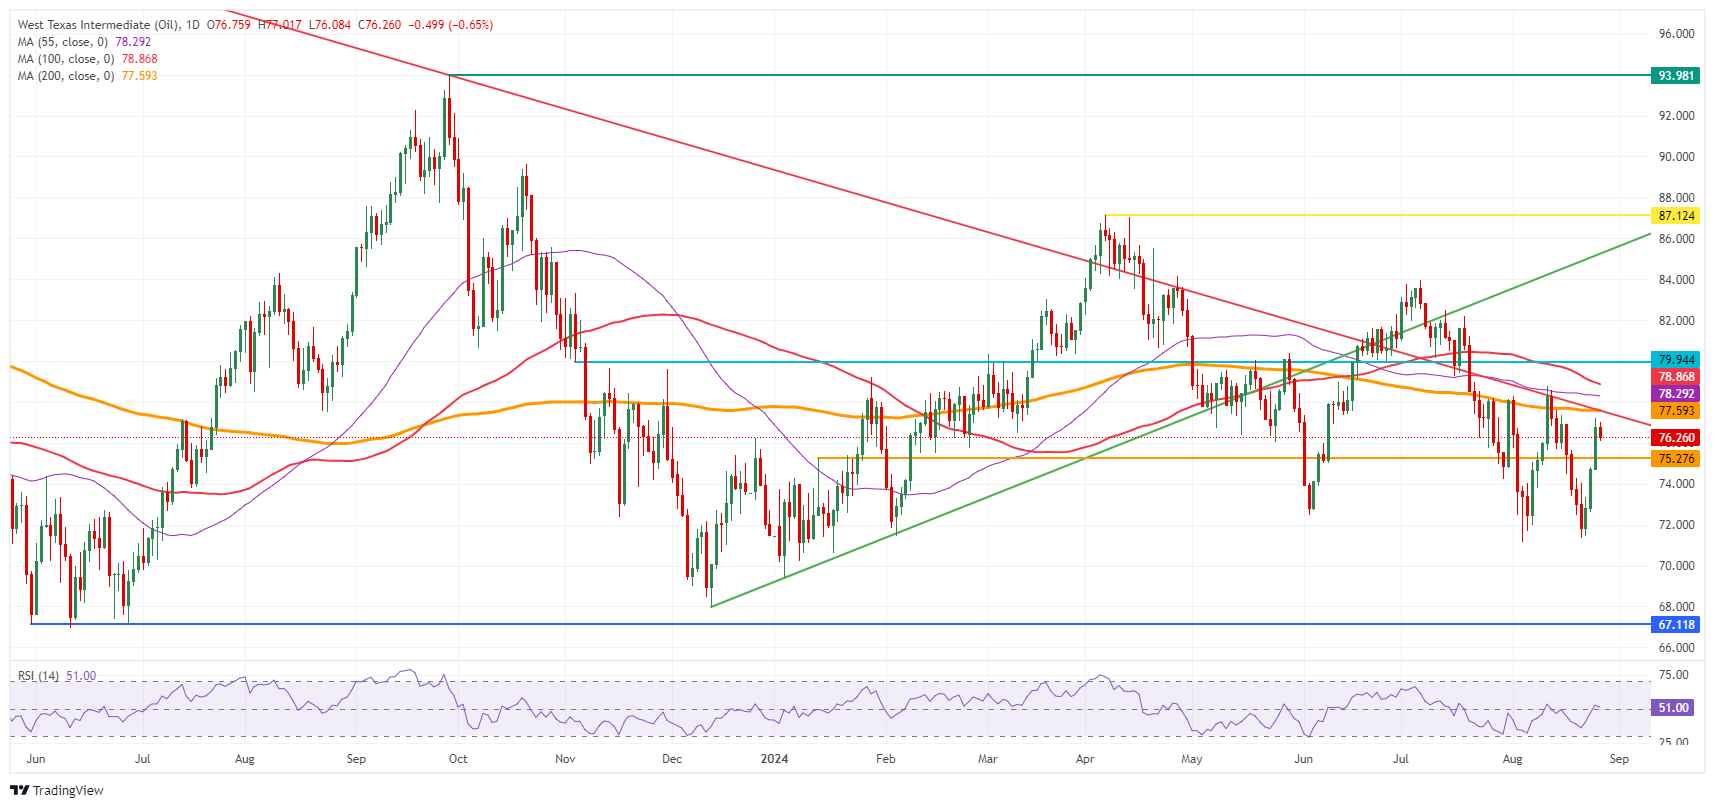
US WTI Crude Oil: Daily Chart
Brent Crude Oil FAQs
Brent Crude Oil is a type of Crude Oil found in the North Sea that is used as a benchmark for international Oil prices. It is considered ‘light’ and ‘sweet’ because of its high gravity and low sulfur content, making it easier to refine into gasoline and other high-value products. Brent Crude Oil serves as a reference price for approximately two-thirds of the world's internationally traded Oil supplies. Its popularity rests on its availability and stability: the North Sea region has well-established infrastructure for Oil production and transportation, ensuring a reliable and consistent supply.
Like all assets supply and demand are the key drivers of Brent Crude Oil price. As such, global growth can be a driver of increased demand and vice versa for weak global growth. Political instability, wars, and sanctions can disrupt supply and impact prices. The decisions of OPEC, a group of major Oil-producing countries, is another key driver of price. The value of the US Dollar influences the price of Brent Crude Oil, since Oil is predominantly traded in US Dollars, thus a weaker US Dollar can make Oil more affordable and vice versa.
The weekly Oil inventory reports published by the American Petroleum Institute (API) and the Energy Information Agency (EIA) impact the price of Brent Crude Oil. Changes in inventories reflect fluctuating supply and demand. If the data shows a drop in inventories it can indicate increased demand, pushing up Oil price. Higher inventories can reflect increased supply, pushing down prices. API’s report is published every Tuesday and EIA’s the day after. Their results are usually similar, falling within 1% of each other 75% of the time. The EIA data is considered more reliable, since it is a government agency.
OPEC (Organization of the Petroleum Exporting Countries) is a group of 13 Oil producing nations who collectively decide production quotas for member countries at twice-yearly meetings. Their decisions often impact Brent Crude Oil prices. When OPEC decides to lower quotas, it can tighten supply, pushing up Oil prices. When OPEC increases production, it has the opposite effect. OPEC+ refers to an expanded group that includes ten extra non-OPEC members, the most notable of which is Russia.
Empfohlene Artikel


