

Silver Price Forecast: XAG/USD plummets over 4.50% turns bearish
- Silver falls below 100-DMA ($28.67), trading at $27.23 after peaking at same.
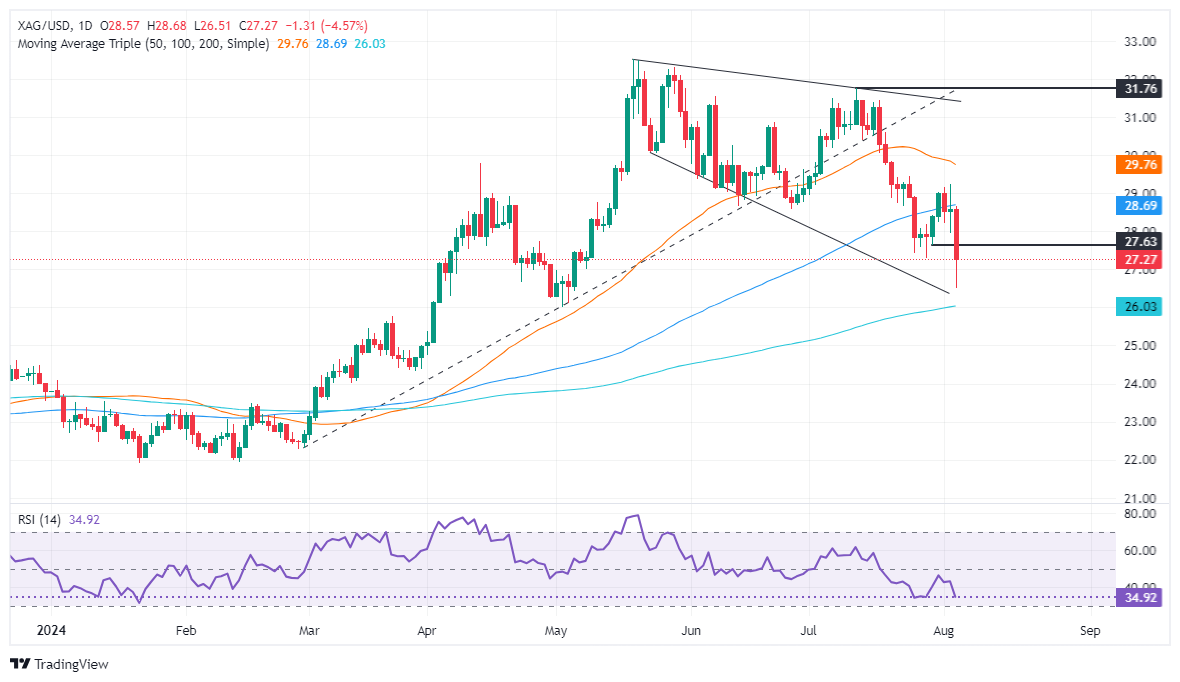
- Technicals suggest more silver declines; key supports at $27.00, 200-DMA at $26.02.
- For recovery, silver needs to regain $28.00; resistances at August 2 high of $29.22 and 50-DMA at $29.79.
Silver's price extended its losses below the 100-day moving average (DMA) of $28.67 and is down over 4.50% as risk appetite deteriorated following weaker data from the United States (US). This reignited recession fears, as ISM Manufacturing PMI and Nonfarm Payrolls report disappointed investors, who flock to safe-haven assets, mostly US Treasuries. The XAG/USD trades at $27.23 after hitting a daily high of $28.67.
XAG/USD Price Forecast: Technical outlook
The grey metal tumbled to a three-month high, with buyers battling to reclaim July’s low of $27.31, which would keep them hopeful of higher prices. However, momentum favors sellers, as shown by the Relative Strength Index (RSI), near hitting oversold conditions in normal trading environments.
If XAG/USD drops and achieves a daily close below $27.00, buyers will be pressured to hold forth at the 200-DMA at $26.02. If broken, sellers will drive Silver spot prices to the latest cycle low at $24.33, the March 27 low.
Conversely, if buyers reclaim $28.00, the next resistance would be the August 2 peak at $29.22. Further upside is seen once cleared, with the next supply area at the 50-DMA at $29.79
XAG/USD Price Action – Daily Chart
Silver FAQs
Silver is a precious metal highly traded among investors. It has been historically used as a store of value and a medium of exchange. Although less popular than Gold, traders may turn to Silver to diversify their investment portfolio, for its intrinsic value or as a potential hedge during high-inflation periods. Investors can buy physical Silver, in coins or in bars, or trade it through vehicles such as Exchange Traded Funds, which track its price on international markets.
Silver prices can move due to a wide range of factors. Geopolitical instability or fears of a deep recession can make Silver price escalate due to its safe-haven status, although to a lesser extent than Gold's. As a yieldless asset, Silver tends to rise with lower interest rates. Its moves also depend on how the US Dollar (USD) behaves as the asset is priced in dollars (XAG/USD). A strong Dollar tends to keep the price of Silver at bay, whereas a weaker Dollar is likely to propel prices up. Other factors such as investment demand, mining supply – Silver is much more abundant than Gold – and recycling rates can also affect prices.
Silver is widely used in industry, particularly in sectors such as electronics or solar energy, as it has one of the highest electric conductivity of all metals – more than Copper and Gold. A surge in demand can increase prices, while a decline tends to lower them. Dynamics in the US, Chinese and Indian economies can also contribute to price swings: for the US and particularly China, their big industrial sectors use Silver in various processes; in India, consumers’ demand for the precious metal for jewellery also plays a key role in setting prices.
Silver prices tend to follow Gold's moves. When Gold prices rise, Silver typically follows suit, as their status as safe-haven assets is similar. The Gold/Silver ratio, which shows the number of ounces of Silver needed to equal the value of one ounce of Gold, may help to determine the relative valuation between both metals. Some investors may consider a high ratio as an indicator that Silver is undervalued, or Gold is overvalued. On the contrary, a low ratio might suggest that Gold is undervalued relative to Silver.
Empfohlene Artikel


