

Crude Oil pares losses, WTI rebounds into congestion on Friday
- WTI bounced back above $77.50 in broad market sentiment rebound.
- Crude Oil markets are recovering despite ongoing concerns over US oversupply.
- Fed rate cut bets continue to get hammered by sticky inflation fears.
West Texas Intermediate (WTI) US Crude Oil rebounded on Friday, recovering from a fresh 12-week low set early in the day at $76.03. WTI remains down on the week, in the red by -2.38% from Monday’s opening bids.
A recovery in broad market risk appetite is bolstering Crude Oil markets after investor hopes for a rate cut from the Federal Reserve (Fed) in September were knocked further back this week. According to the CME’s FedWatch Tool, rate traders are pricing in slightly-worse-than-even odds of at least a quarter-point rate trim from the Federal Open Market Committee (FOMC) in September, steeply down from 70% odds priced in at the outset of the trading week.
US Durable Goods Orders firmly recovered in April, rising 0.7% MoM compared to the forecast -0.8% decline, while March’s figure was revised down to 0.8% from the initial print of 2.6%. University of Michigan 5-year Consumer Inflation Expectations also eased slightly to 3.0% for the month of May, falling a tick lower from the forecast hold at 3.1%. Easing inflation expectations are helping battered investor sentiment, with commodity traders still licking their wounds after a collapse in September rate cut hopes.
Forecasting the Coming Week: Fedspeak and PCE remain in the spotlight
Talking points from policymakers at the Fed dominated financial headlines this week as Fed officials continue to press down on rate cut hopes, pushing back with cautionary statements that the Fed still needs more evidence that inflation will eventually drop to the Fed’s target of 2% annual price growth.
US Crude Oil production continues to weigh on barrel bulls after US supply counts snubbed forecast declines, showing another buildup in US Crude Oil supply lines. Energy traders were hoping for an extended decline in US supply stocks, but a surprise buildup in barrel counts from both the American Petroleum Institute (API) and the Energy Information Administration (EIA) have left Crude Oil speculators hoping for an as-yet-unseen uptick in demand to eat away at US pumping capacity.
WTI technical outlook
US Crude Oil rebounded from a 12-week low to recapture the $77.50 level ahead of the week’s close. WTI continues to trade on the bearish side of the 200-hour Exponential Moving Average at $78.05, but Friday’s bullish recovery sends US Crude Oil back into familiar technical congestion.
WTI has cycled the 200-day EMA at $79.03 since dipping to a low of $68.00 in late 2023. Despite holding onto gains from 2024’s opening prices, WTI remains down nearly -11% from the year’s peaks near $87.20.
WTI hourly chart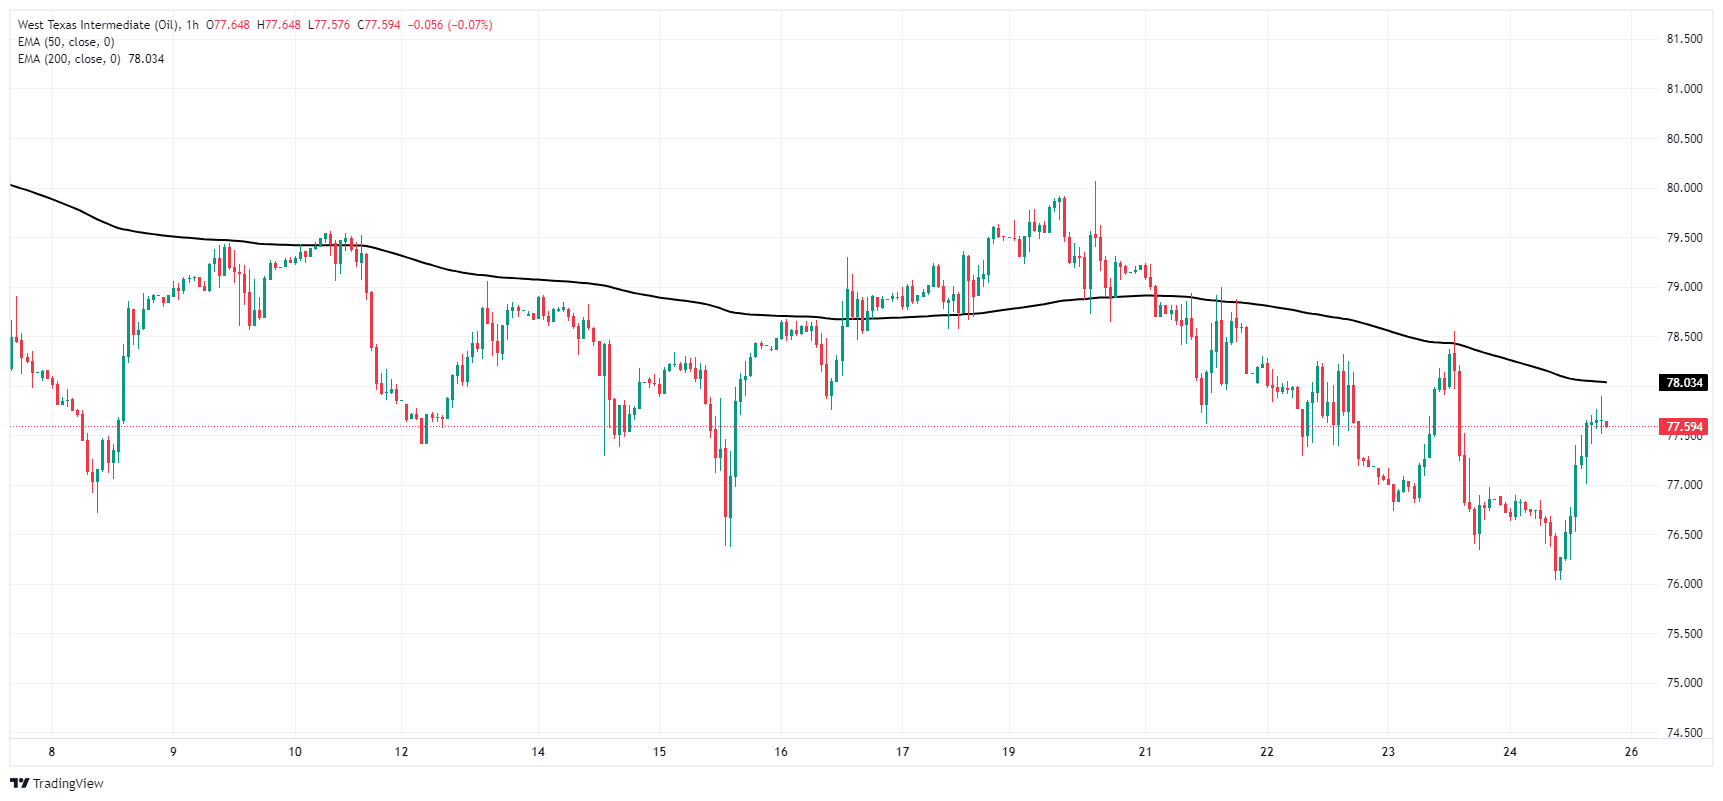
WTI daily chart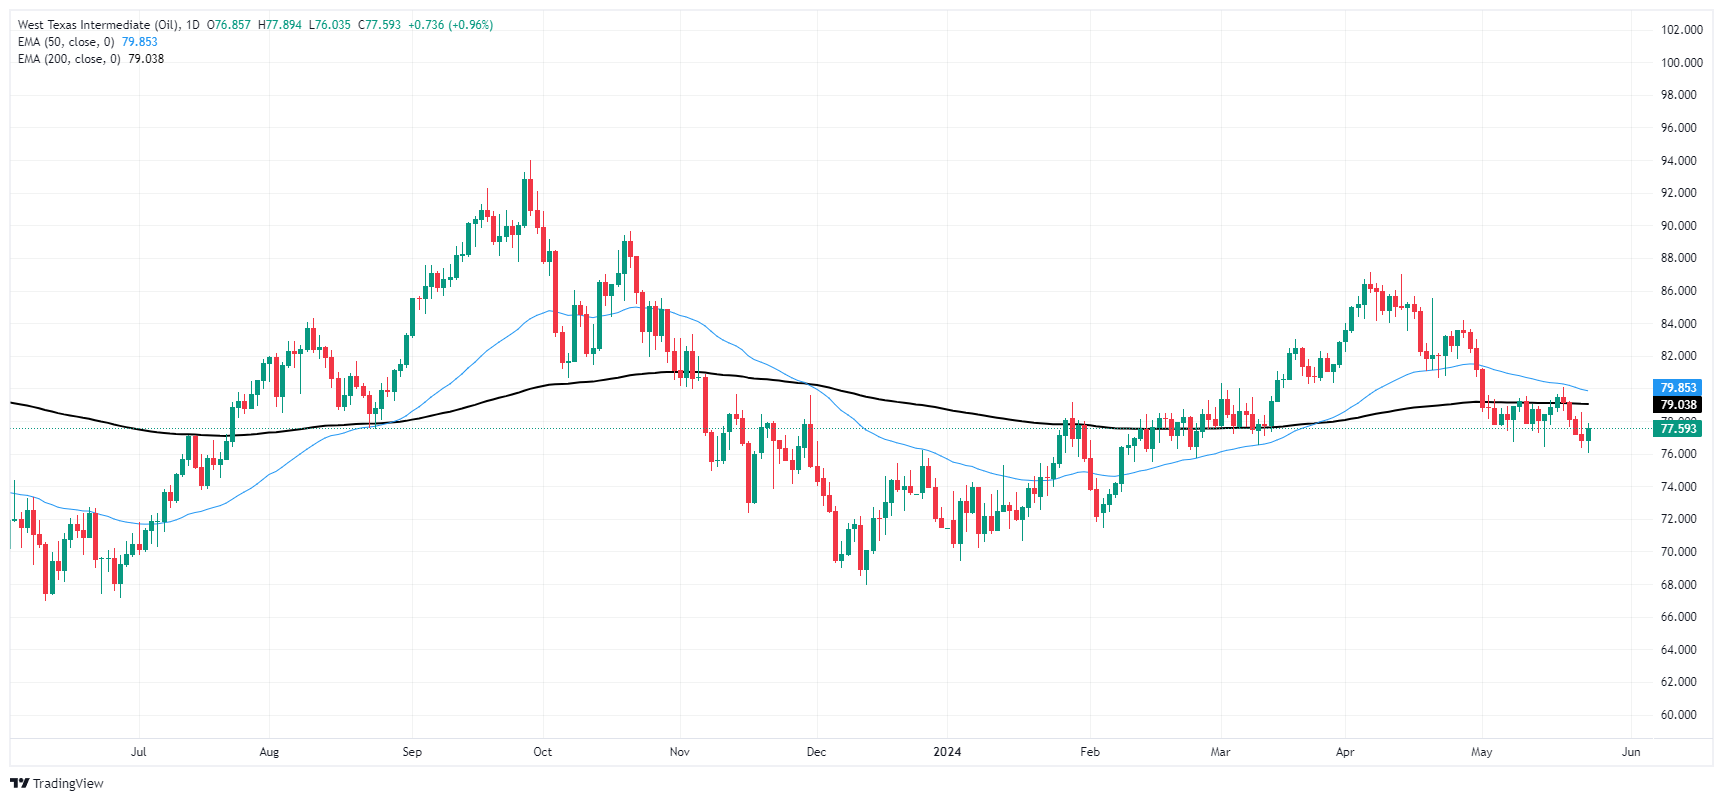
Empfohlene Artikel


