GBP/USD Price Analysis: Remains depressed below 1.2800, downside potential seems limited

Quelle Fxstreet
  • GBP/USD drifts lower on Thursday amid the hawkish Fed-inspired USD buying interest.
  • The mixed technical setup warrants some caution before positioning for deeper losses.
  • A daily close above the 1.2800 mark will set the stage for a further appreciating move.

The GBP/USD pair edges lower during the Asian session on Thursday and retreats further from over a three-month top, around the 1.2860 region touched the previous day, in reaction to softer US consumer inflation figures. Spot prices, for now, seem to have snapped a three-day winning streak and currently trade around the 1.2785 area, down 0.10% for the day.

The US Dollar (USD) builds on the overnight bounce from the weekly low in the wake of the Federal Reserve's (Fed) hawkish surprise, indicating that fewer rate cuts were needed this year. Moreover, flash figures published on Wednesday showed that the UK economic growth stalled in April after the muted rebound from last year’s recession. This, in turn, is seen undermining the British Pound (GBP) and contributing to the offered tone surrounding the GBP/USD pair. 

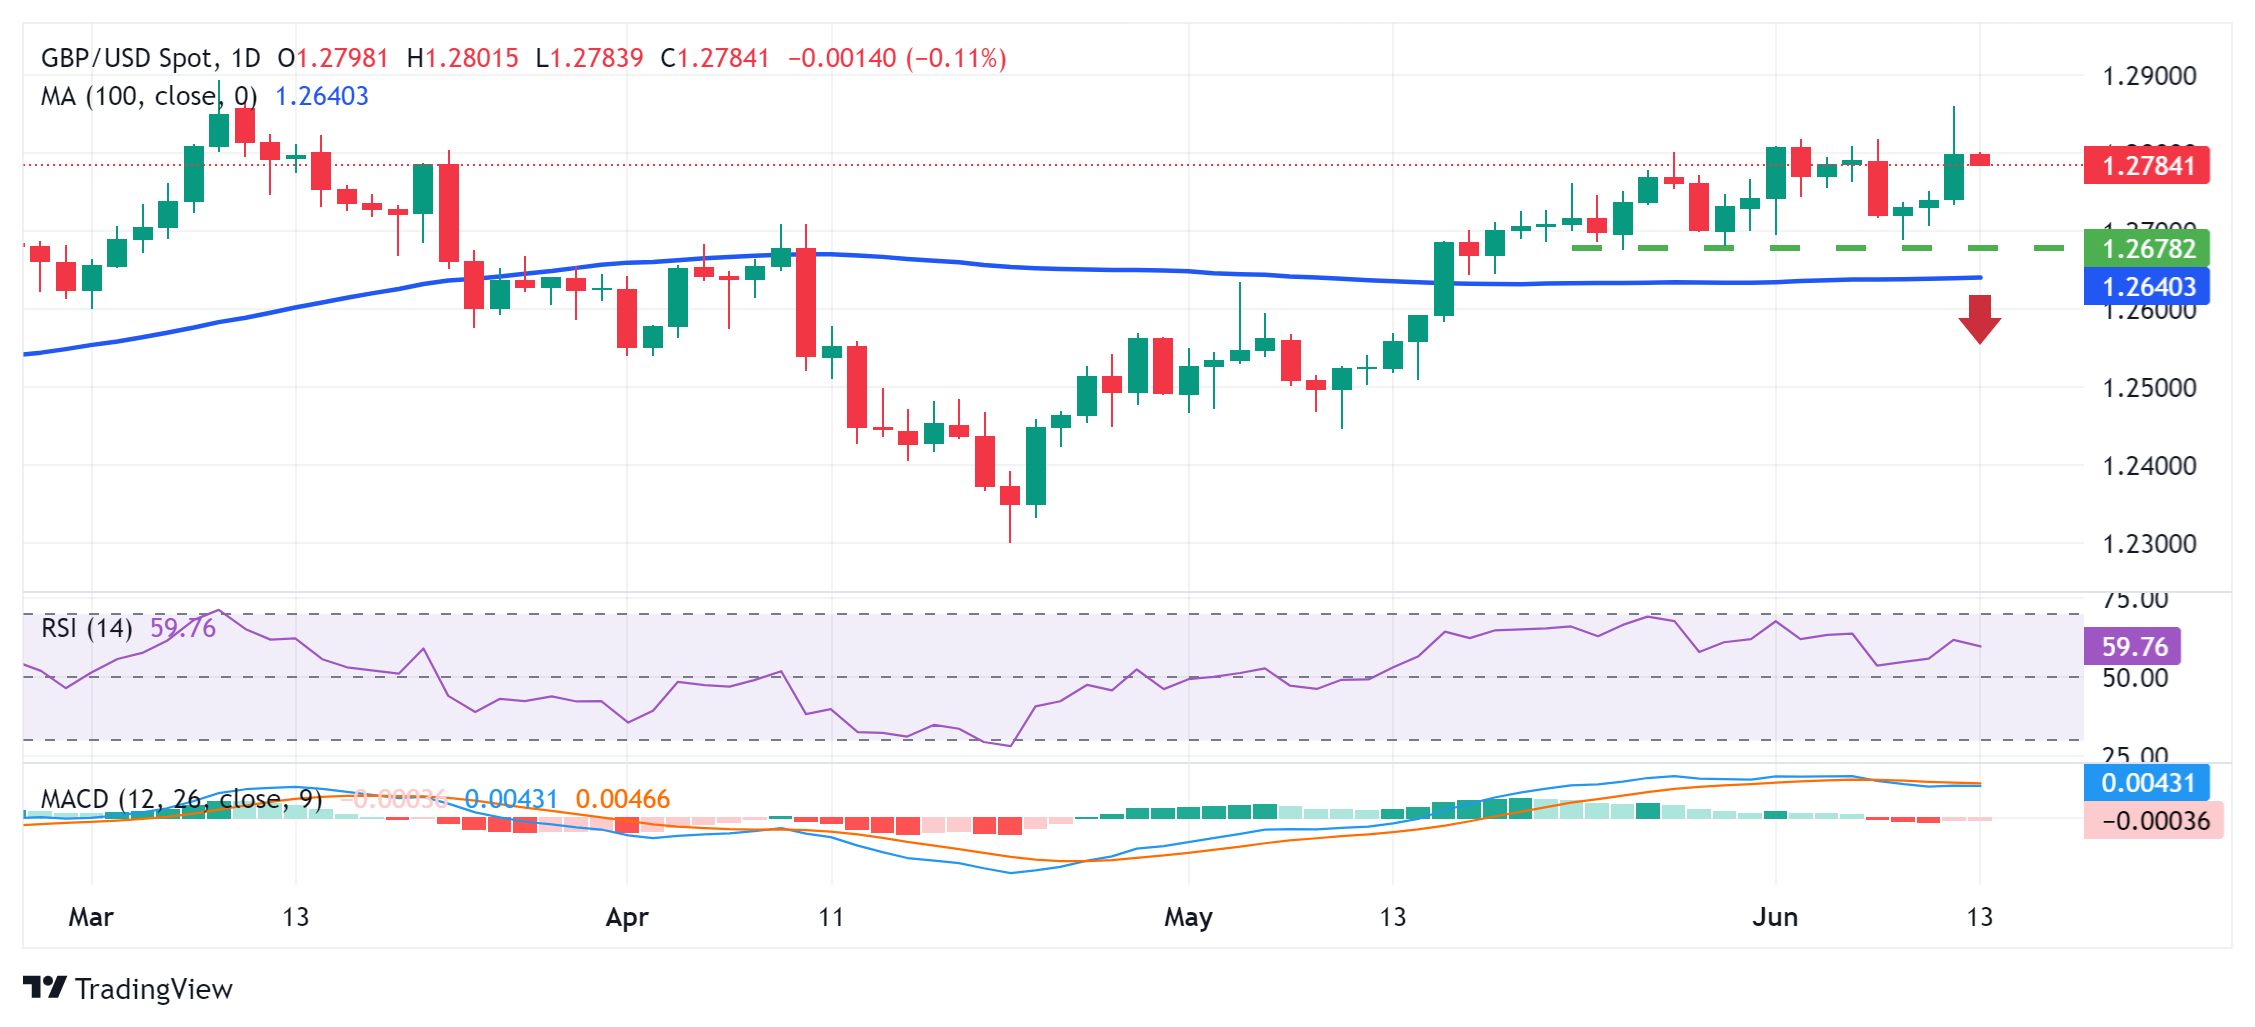
From a technical perspective, the recent repeated failures to find acceptance above the 1.2800 mark warrant some caution for bullish traders ahead of the UK national election on July 4. That said, mixed oscillators on the daily chart make it prudent to wait for strong follow-through selling before confirming that the recent strong rally from the YTD trough touched in April has run its course and positioning for any meaningful depreciating move for the GBP/USD pair.

Meanwhile, any further decline is more likely to find some support near the 1.2755-1.2750 horizontal zone, below which spot prices could slide to the 1.2715-1.2710 intermediate support. The downfall could extend further towards the 1.2690-1.2685 region en route to the 100-day Simple Moving Average (SMA) support, currently pegged near the 1.2640-1.2635 area. A convincing break below the latter will be seen as a fresh trigger for bears and pave the way for further losses.

On the flip side, positive momentum back above the 1.2800 mark might continue to face resistance near the 1.2855-1.2860 region. A sustained strength beyond should allow the GBP/USD pair to retest the YTD peak, around the 1.2900 neighborhood touched in March, and climb further towards the 1.2950 resistance before aiming to reclaim the 1.3000 psychological mark for the first time since July 2023.

GBP/USD daily chart
fxsoriginal

GBP/USD

Overview
Today last price 1.2784
Today Daily Change -0.0014
Today Daily Change % -0.11
Today daily open 1.2798
 
Trends
Daily SMA20 1.274
Daily SMA50 1.2609
Daily SMA100 1.2639
Daily SMA200 1.2548
 
Levels
Previous Daily High 1.286
Previous Daily Low 1.2733
Previous Weekly High 1.2818
Previous Weekly Low 1.2695
Previous Monthly High 1.2801
Previous Monthly Low 1.2446
Daily Fibonacci 38.2% 1.2812
Daily Fibonacci 61.8% 1.2782
Daily Pivot Point S1 1.2734
Daily Pivot Point S2 1.267
Daily Pivot Point S3 1.2606
Daily Pivot Point R1 1.2861
Daily Pivot Point R2 1.2925
Daily Pivot Point R3 1.2989


Haftungsausschluss: Nur zu Informationszwecken. Die bisherige Performance ist kein verlässlicher Indikator für zukünftige Ergebnisse.
placeholder
Ripple am Scheideweg: XRP-Daten zeichnen ein dramatisches BildRipple (XRP) rutscht auf 2,12 US-Dollar ab und testet die Schlüsselzone bei 2,07–2,10 US-Dollar, während schwaches Sentiment, passiver Retail und bärische Indikatoren auf der einen Seite sowie DeFi- und Staking-Pläne, ein neuer Canary XRP ETF und steigende Funding Rates auf der anderen Seite darüber entscheiden, ob der Kurs Richtung 2,46 oder 1,90 US-Dollar läuft.
Autor  Mitrade Team
Do. 20.Nov
Ripple (XRP) rutscht auf 2,12 US-Dollar ab und testet die Schlüsselzone bei 2,07–2,10 US-Dollar, während schwaches Sentiment, passiver Retail und bärische Indikatoren auf der einen Seite sowie DeFi- und Staking-Pläne, ein neuer Canary XRP ETF und steigende Funding Rates auf der anderen Seite darüber entscheiden, ob der Kurs Richtung 2,46 oder 1,90 US-Dollar läuft.
placeholder
Bitcoin unter Druck: Der Kampf um die 90.000-Dollar-Marke und drohende AbwärtsrisikenBitcoin (BTC) ist unter 90.000 US-Dollar gefallen, handelt unter dem 100-Stunden-Durchschnitt und kämpft mit Widerständen bei 87.000, 89.000 und 91.000 US-Dollar, während Unterstützungen bei 85.500, 85.000, 83.200, 82.500 und insbesondere 80.000 US-Dollar über die nächsten Kursbewegungen entscheiden.
Autor  Mitrade Team
Gestern 04: 22
Bitcoin (BTC) ist unter 90.000 US-Dollar gefallen, handelt unter dem 100-Stunden-Durchschnitt und kämpft mit Widerständen bei 87.000, 89.000 und 91.000 US-Dollar, während Unterstützungen bei 85.500, 85.000, 83.200, 82.500 und insbesondere 80.000 US-Dollar über die nächsten Kursbewegungen entscheiden.
placeholder
Top-Verlierer im Krypto-Markt: Starknet, Telcoin und MYX Finance brechen ein – Bitcoin rutscht unter 86.000 DollarStarknet, Telcoin und MYX Finance zählen laut CoinGecko zu den größten Verlierern des Tages: Während BTC unter 86.000 US-Dollar fällt und die drei Tokens binnen 24 Stunden jeweils mehr als 18 % einbüßen, rücken bei STRK (0,26/0,15 US-Dollar), TEL (0,007/0,004 US-Dollar) und MYX (3,49/1,69 US-Dollar) klar definierte Widerstände, Unterstützungen und nachlassendes RSI-Momentum in den Fokus.
Autor  Mitrade Team
Gestern 06: 10
Starknet, Telcoin und MYX Finance zählen laut CoinGecko zu den größten Verlierern des Tages: Während BTC unter 86.000 US-Dollar fällt und die drei Tokens binnen 24 Stunden jeweils mehr als 18 % einbüßen, rücken bei STRK (0,26/0,15 US-Dollar), TEL (0,007/0,004 US-Dollar) und MYX (3,49/1,69 US-Dollar) klar definierte Widerstände, Unterstützungen und nachlassendes RSI-Momentum in den Fokus.
placeholder
Top 3 Kursprognose: Bitcoin, Ethereum, Ripple – Bärenmarkt festigt sich, BTC, ETH und XRP unter hohem VerkaufsdruckBitcoin, Ethereum und XRP haben in dieser Woche rund 8 %, 9 % bzw. 10 % verloren; BTC fällt unter 86.000 US-Dollar, ETH unter 2.900 US-Dollar und XRP unter 2 US-Dollar, wobei Unterstützungen bei 85.000/80.000 (BTC), 2.749/3.017 (ETH) und 1.77/2.35 US-Dollar (XRP) über eine mögliche kurzfristige Gegenbewegung oder eine Fortsetzung der Korrektur entscheiden.
Autor  Mitrade Team
Gestern 06: 19
Bitcoin, Ethereum und XRP haben in dieser Woche rund 8 %, 9 % bzw. 10 % verloren; BTC fällt unter 86.000 US-Dollar, ETH unter 2.900 US-Dollar und XRP unter 2 US-Dollar, wobei Unterstützungen bei 85.000/80.000 (BTC), 2.749/3.017 (ETH) und 1.77/2.35 US-Dollar (XRP) über eine mögliche kurzfristige Gegenbewegung oder eine Fortsetzung der Korrektur entscheiden.
placeholder
XRP am Scheideweg: Hält die 2-Dollar-Festung oder droht der Absturz?XRP verteidigt die Marke von 2,00 US-Dollar, während US-Spot-ETFs kontinuierlich Zuflüsse verzeichnen, der Derivatemarkt jedoch schwach bleibt – ohne einen Ausbruch über 2,45 und 2,72 US-Dollar bleibt Ripple trotz institutioneller Nachfrage im technisch angeschlagenen Modus.
Autor  Mitrade Team
Gestern 06: 47
XRP verteidigt die Marke von 2,00 US-Dollar, während US-Spot-ETFs kontinuierlich Zuflüsse verzeichnen, der Derivatemarkt jedoch schwach bleibt – ohne einen Ausbruch über 2,45 und 2,72 US-Dollar bleibt Ripple trotz institutioneller Nachfrage im technisch angeschlagenen Modus.
verbundene Finanzinstrumente
goTop
quote