USD/SGD holds firm as markets assess robust US data, markets delay cuts

Quelle Fxstreet
  • USD/SGD rose to 1.3515 and managed to clear all of its daily losses.
  • The US saw an uptick in manufacturing and services PMI data which bolstered the Dollar.
  • Strong Jobless Claims figures are also painting a resilient US economy which justifies the delay of rate cuts by the Fed.

The USD/SGD recovered from daily lows, and ahead of the Asian session is trading with slight gains. The pair's movements have been influenced primarily by the cautious posture of the Federal Open Market Committee (FOMC) seen in Wednesday’s minutes, and the strong US Manufacturing and Services PMI figures. Strong Unemployment data released during the European session contributed to the recovery.

While the US Federal Reserve maintains its cautious approach towards monetary easing, strong manufacturing and service sector data seem to justify the bank’s stance. May's S&P Global Manufacturing PMI surpassed market expectations, increasing to 50.9 compared to April's figure of 50.0. Furthermore, a robust increase was also seen in the services PMI, which accelerated to 54.8 from 51.3, undermining market expectations. Additionally, the US Department of Labor reported a rise in Jobless Claims, which was below the expected estimates, suggesting that the labor market remains strong.

The strong economic figures fueled a rise in US Treasury yields which seems to be signalling that markets are delaying the start of the easing cycle. This is corroborated by the CME FedWatch Tool which indicated that the odds of a cut in September declined just below 40%. Next week, the US will release April’s Personal Consumption Expenditures (PCE) data which will provide additional insights into the US economy..

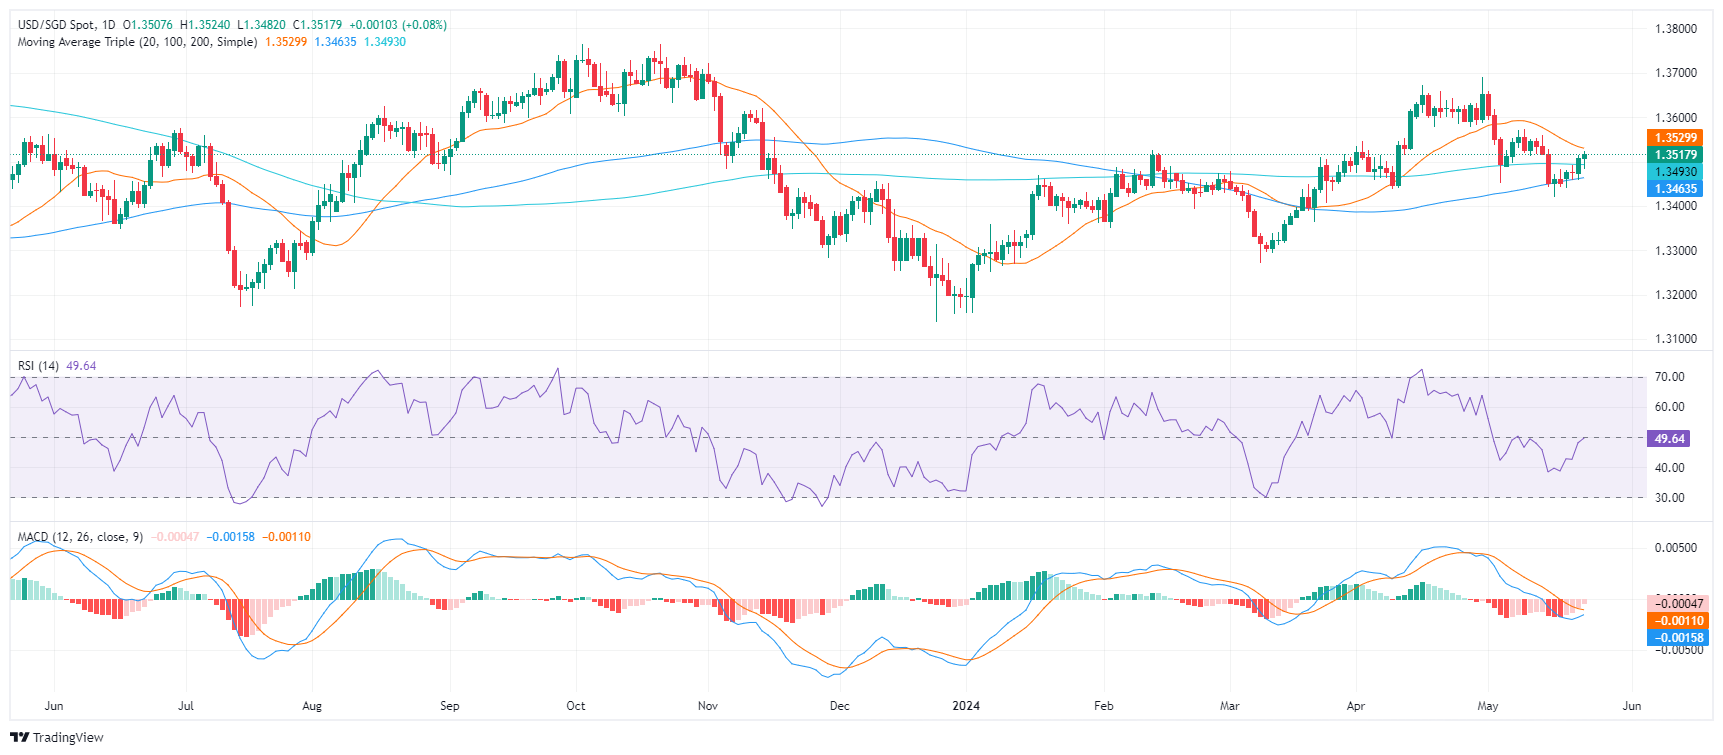
USD/SGD technical analysis

Within the daily overview, the Relative Strength Index (RSI) is treading in negative territory, inclining slightly towards a neutral trend while oscillating around the 50 mark. However, a recovery was seen after bottoming at 44 which may imply that the buyers are gaining ground. The decreasing red bars of the Moving Average Convergence Divergence (MACD) histogram reveals a decreasing selling momentum, providing a signal that the bear's time might be over.

USD/SGD daily chart

USD/SGD

Overview
Today last price 1.3518
Today Daily Change 0.0010
Today Daily Change % 0.07
Today daily open 1.3508
 
Trends
Daily SMA20 1.3534
Daily SMA50 1.352
Daily SMA100 1.3461
Daily SMA200 1.3493
 
Levels
Previous Daily High 1.3514
Previous Daily Low 1.3459
Previous Weekly High 1.356
Previous Weekly Low 1.342
Previous Monthly High 1.369
Previous Monthly Low 1.3438
Daily Fibonacci 38.2% 1.3493
Daily Fibonacci 61.8% 1.348
Daily Pivot Point S1 1.3473
Daily Pivot Point S2 1.3438
Daily Pivot Point S3 1.3418
Daily Pivot Point R1 1.3528
Daily Pivot Point R2 1.3549
Daily Pivot Point R3 1.3583


Haftungsausschluss: Nur zu Informationszwecken. Die bisherige Performance ist kein verlässlicher Indikator für zukünftige Ergebnisse.
placeholder
Cardano rutscht unter $0,36: Geopolitische Spannungen belasten RisikoassetsCardano (ADA) fällt am Donnerstag unter $0,36 und handelt bei $0,35; US-Iran-Spannungen und ein Long-to-Short-Ratio von 0,71 erhöhen das Risiko eines Tests von $0,32 (31. Dezember) und darunter $0,27 (10. Oktober).
Autor  Mitrade Team
vor 11 Stunden
Cardano (ADA) fällt am Donnerstag unter $0,36 und handelt bei $0,35; US-Iran-Spannungen und ein Long-to-Short-Ratio von 0,71 erhöhen das Risiko eines Tests von $0,32 (31. Dezember) und darunter $0,27 (10. Oktober).
placeholder
Solana unter Druck: SOL rutscht weiter ab und steuert auf Schlüsselstütze bei $116 zuSolana (SOL) fällt am Donnerstag rund 2% und nähert sich der Schlüsselstütze bei $116; sinkendes Open Interest ($7,42 Mrd.), negative Funding Rate (-0,0042%) und Long-Liquidationen erhöhen das Risiko eines Rutsches Richtung $100 und $95.
Autor  Mitrade Team
vor 12 Stunden
Solana (SOL) fällt am Donnerstag rund 2% und nähert sich der Schlüsselstütze bei $116; sinkendes Open Interest ($7,42 Mrd.), negative Funding Rate (-0,0042%) und Long-Liquidationen erhöhen das Risiko eines Rutsches Richtung $100 und $95.
placeholder
Gold setzt Rekordserie fort: XAU/USD steigt am neunten Tag in Folge Richtung $5.600Gold (XAU/USD) steigt am neunten Tag in Folge auf die $5.600er-Zone, getrieben von Safe-Haven-Nachfrage, einem USD-Tief seit Februar 2022 und anhaltenden Sorgen um die Unabhängigkeit der Fed trotz unveränderter Zinsen.
Autor  Mitrade Team
vor 12 Stunden
Gold (XAU/USD) steigt am neunten Tag in Folge auf die $5.600er-Zone, getrieben von Safe-Haven-Nachfrage, einem USD-Tief seit Februar 2022 und anhaltenden Sorgen um die Unabhängigkeit der Fed trotz unveränderter Zinsen.
placeholder
Krypto-Gewinner trotz Marktpause: Worldcoin rutscht ab, Canton vor Ausbruch – Jupiter stößt am 50-Tage-EMA anWorldcoin (WLD) korrigiert nach der 25%-Rally am 100-Tage-EMA, Canton (CC) steht vor dem Breakout über $0.1624 und Jupiter (JUP) stößt nach 16% in drei Tagen am 50-Tage-EMA bei $0.2174 an.
Autor  Mitrade Team
vor 14 Stunden
Worldcoin (WLD) korrigiert nach der 25%-Rally am 100-Tage-EMA, Canton (CC) steht vor dem Breakout über $0.1624 und Jupiter (JUP) stößt nach 16% in drei Tagen am 50-Tage-EMA bei $0.2174 an.
placeholder
Silber nach Rekord bei $119,42 etwas leichter: XAG/USD rutscht Richtung $117,50 – Rally bleibt aber intaktSilber (XAG/USD) fällt nach Rekord bei $119,42 leicht Richtung $117,50, bleibt aber durch Safe-Haven-Nachfrage, Handelskonflikte, geopolitische Risiken und starken Industriebedarf weiter unterstützt.
Autor  Mitrade Team
vor 14 Stunden
Silber (XAG/USD) fällt nach Rekord bei $119,42 leicht Richtung $117,50, bleibt aber durch Safe-Haven-Nachfrage, Handelskonflikte, geopolitische Risiken und starken Industriebedarf weiter unterstützt.
verbundene Finanzinstrumente
goTop
quote