EUR/USD strengths amid uncertainty over ECB rate cuts in July

Quelle Fxstreet
  • EUR/USD remains firm near 1.0900 due to multiple tailwinds.
  • ECB’s Schnabel remains uncertain over the central bank extending rate cuts beyond June.
  • Fed policymakers emphasize keeping interest rates higher for longer.

EUR/USD clings to gains near 1.0900 in Monday’s European session. The major currency pair remains in bullish territory due to investors’ higher risk appetite. The Euro has performed strongly in the past few trading sessions as market participants turn slightly cautious about whether the European Central Bank (ECB) will extend the policy-tightening spell beyond the June meeting.

The ECB is widely anticipated to start reducing interest rates from the June meeting. However, ECB policymakers remain divided over the rate-cut move in the July meeting. A few policymakers remain worried that an aggressive rate-cut cycle could revamp price pressures and offset the impact yet made on inflation.

Last week, ECB board member Isabel Schnabel said that depending on incoming data, a rate cut in June may be appropriate but the path beyond June is much more uncertain. Schnabel added that she cannot pre-commit to any particular rate path due to very high uncertainty.

On the economic data front, investors will shift focus to the Eurozone and the United States preliminary Purchasing Managers Index (PMI) data for May, which will be published on Thursday. The PMI data will indicate their economic outlook.

Daily digest market movers: EUR/USD will dance to the tunes of the Eurozone/US preliminary PMI

  • EUR/USD trades in a tight range below the round-level resistance of 1.0900. The shared currency pair is expected to remain quiet as investors shift focus to the Federal Open Market Committee (FOMC) minutes for the May meeting, which will be published on Wednesday. The FOMC minutes will provide a detailed explanation behind interest rates remaining steady and policymakers’ views about the interest rate outlook.
  • The communication from Fed policymakers on the interest rate outlook is expected to have remained hawkish as inflationary pressures in the first three months of this year accelerated. However, the Consumer Price Index (CPI) data for April declined as expected due to lower prices of utility gas piped services, and used car and trucks. Fed policymakers are expected to have avoided supporting for further policy-tightening.
  • Though the decline in price pressures has provided some relief that the progress in the disinflation process has not stalled, Fed policymakers remain leaned towards a restrictive policy stance for a longer period to build confidence that inflation will sustainably return to the desired rate of 2%.
  • Last week, New York Fed Bank President John Williams said the monetary policy is restrictive and is in a good place. He doesn’t see any economic indicator suggesting the need to change the stance of monetary policy now. When asked about the inflation outlook, Williams said: “In the very near term, I don't expect to get that greater confidence that we need to see on inflation progress towards a 2% goal," Reuters reported.

Technical Analysis: EUR/USD holds gains inspired by triangle breakout

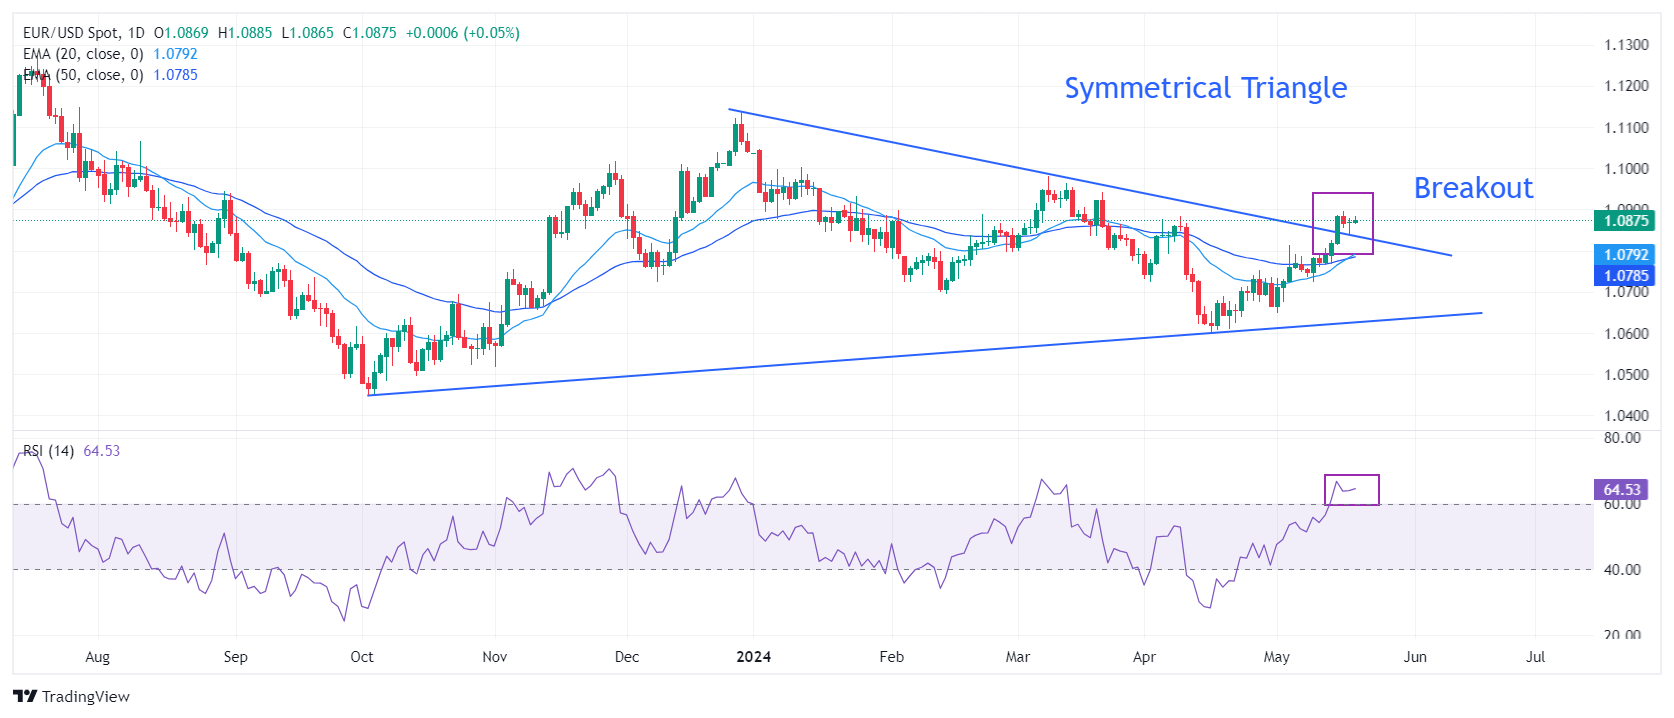
EUR/USD holds the breakout of the Symmetrical Triangle chart pattern seen on a daily timeframe. The stabilization of the major currency pair above the breakout region suggests that the asset is quite bullish. Also, a bullish crossover of the 20-day and 50-day Exponential Moving Averages (EMAs) around 1.0780 has improved the near-term outlook of the pair.

The 14-period Relative Strength Index (RSI) has shifted comfortably into the bullish range of 60.00-80.00, suggesting that the momentum has leaned toward the upside.

Euro FAQs

The Euro is the currency for the 20 European Union countries that belong to the Eurozone. It is the second most heavily traded currency in the world behind the US Dollar. In 2022, it accounted for 31% of all foreign exchange transactions, with an average daily turnover of over $2.2 trillion a day. EUR/USD is the most heavily traded currency pair in the world, accounting for an estimated 30% off all transactions, followed by EUR/JPY (4%), EUR/GBP (3%) and EUR/AUD (2%).

The European Central Bank (ECB) in Frankfurt, Germany, is the reserve bank for the Eurozone. The ECB sets interest rates and manages monetary policy. The ECB’s primary mandate is to maintain price stability, which means either controlling inflation or stimulating growth. Its primary tool is the raising or lowering of interest rates. Relatively high interest rates – or the expectation of higher rates – will usually benefit the Euro and vice versa. The ECB Governing Council makes monetary policy decisions at meetings held eight times a year. Decisions are made by heads of the Eurozone national banks and six permanent members, including the President of the ECB, Christine Lagarde.

Eurozone inflation data, measured by the Harmonized Index of Consumer Prices (HICP), is an important econometric for the Euro. If inflation rises more than expected, especially if above the ECB’s 2% target, it obliges the ECB to raise interest rates to bring it back under control. Relatively high interest rates compared to its counterparts will usually benefit the Euro, as it makes the region more attractive as a place for global investors to park their money.

Data releases gauge the health of the economy and can impact on the Euro. Indicators such as GDP, Manufacturing and Services PMIs, employment, and consumer sentiment surveys can all influence the direction of the single currency. A strong economy is good for the Euro. Not only does it attract more foreign investment but it may encourage the ECB to put up interest rates, which will directly strengthen the Euro. Otherwise, if economic data is weak, the Euro is likely to fall. Economic data for the four largest economies in the euro area (Germany, France, Italy and Spain) are especially significant, as they account for 75% of the Eurozone’s economy.

Another significant data release for the Euro is the Trade Balance. This indicator measures the difference between what a country earns from its exports and what it spends on imports over a given period. If a country produces highly sought after exports then its currency will gain in value purely from the extra demand created from foreign buyers seeking to purchase these goods. Therefore, a positive net Trade Balance strengthens a currency and vice versa for a negative balance.


Haftungsausschluss: Nur zu Informationszwecken. Die bisherige Performance ist kein verlässlicher Indikator für zukünftige Ergebnisse.
placeholder
XRP wackelt erneut: Drei Signale, die den nächsten Rücksetzer auslösen könntenXRP stabilisiert sich am Montag nahe 1,90 US-Dollar nach dem Dip auf 1,81, doch sinkende XRPL-Aktivität (45.000), ein Einbruch profitabler Bestände (50,4%) und fallendes Open Interest (3,26 Mrd. USD) halten das Risiko einer Korrektur bis 1,61 US-Dollar hoch, während Widerstände bei 2,03/2,16/2,29 US-Dollar liegen.
Autor  Mitrade Team
Di. 27.Jan
XRP stabilisiert sich am Montag nahe 1,90 US-Dollar nach dem Dip auf 1,81, doch sinkende XRPL-Aktivität (45.000), ein Einbruch profitabler Bestände (50,4%) und fallendes Open Interest (3,26 Mrd. USD) halten das Risiko einer Korrektur bis 1,61 US-Dollar hoch, während Widerstände bei 2,03/2,16/2,29 US-Dollar liegen.
placeholder
Krypto-Ausblick: Bitcoin stabilisiert sich über 87.787 US-Dollar – Ether vor der nächsten Hürde, XRP bleibt fragil• Bitcoin pendelt am Mittwoch um 89.000 US-Dollar und hat sich nach der Vorwochenkorrektur bislang um knapp 3% erholt – entscheidend bleibt die Zone um 87.787 US-Dollar. • Ethereum arbeitet sich an die Widerstandszone heran: Erst ein Tagesschluss über 3.017 US-Dollar und der 50-Tage-EMA bei 3.101 US-Dollar würde den Weg nach oben freimachen. • XRP prallt von 1,83 US-Dollar ab und steht wieder bei 1,90 US-Dollar – doch RSI und MACD sprechen weiter für Vorsicht. Nach der kräftigen Korrektur der vergangenen Woche setzt sich im Kryptomarkt eine vorsichtige Stabilisierung durch. Bitcoin, Ether und XRP bauen ihre Erholung aus, stoßen nun aber auf charttechnisch wichtige Marken, an denen sich entscheidet, ob aus der Gegenbewegung mehr wird – oder ob der nächste Rücksetzer folgt. Bitcoin: 87.787 US-Dollar bleibt der Dreh- und Angelpunkt Bitcoin hat am Montag nach der 7,48%-Korrektur der Vorwoche wieder oberhalb der Mittellinie eines horizontalen Parallelkanals bei 87.787 US-Dollar geschlossen. Am Dienstag verteidigte der Kurs diese Zone erneut, am Mittwoch notiert BTC bei rund 89.300 US-Dollar. Hält 87.787 US-Dollar als Support, rückt die obere Begrenzung des Musters bei 90.000 US-Dollar in den Fokus. Der RSI (Tag) liegt bei 45 und steigt in Richtung der neutralen 50 – ein Hinweis auf nachlassenden Verkaufsdruck. Auch der MACD entspannt sich: Die Linien nähern sich an, die roten Histogrammbalken unterhalb der Nulllinie werden schwächer. Bricht Bitcoin dagegen per Tagesschluss wieder unter 87.787 US-Dollar, bleibt die Unterseite anfällig – dann würde die nächste Auffangzone bei 85.569 US-Dollar (zugleich 78,6% Fibonacci-Retracement) wieder relevant. Ethereum: Erst über 3.017 und 3.101 US-Dollar wird es konstruktiver Ethereum startete positiv in die Woche und legte bis Dienstag um 7,62% zu – nach der 14,22%-Korrektur in der Woche davor. Am Mittwoch nähert sich ETH dem zentralen Widerstand bei 3.017 US-Dollar. Für ein klareres Erholungssignal braucht es mehr als nur Intraday-Stärke: Ein Ausbruch über 3.017 US-Dollar und ein Tagesschluss über dem 50-Tage-EMA bei 3.101 US-Dollar könnten den Blick in Richtung des Hochs vom 14. Januar bei 3.402 US-Dollar lenken. Die Momentum-Indikatoren (RSI und MACD) deuten zwar auf nachlassenden Abwärtsdruck hin, aber das Setup bleibt empfindlich. Kommt es stattdessen zu einer erneuten Abweisung an der Widerstandszone, rückt auf der Unterseite das 61,8% Fibonacci-Retracement bei 2.749 US-Dollar wieder ins Blickfeld. XRP: Rebound ja – Trendwende noch nicht XRP hat am Sonntag die tägliche Unterstützung bei 1,83 US-Dollar getestet und anschließend binnen zwei Tagen um 4,51% zugelegt. Am Mittwoch handelt der Kurs bei 1,90 US-Dollar. Solange 1,83 US-Dollar hält, kann sich die Erholung in Richtung des nächsten Widerstands bei 1,96 US-Dollar fortsetzen. Allerdings ist der Unterton noch nicht gedreht: Der RSI liegt bei 42 und damit weiter unter der neutralen 50. Zudem bleibt das Bild im MACD belastet – das bärische Crossover der Vorwoche ist weiterhin aktiv, was das Rückschlagrisiko erhöht. Fällt XRP per Tagesschluss erneut unter 1,83 US-Dollar, wäre ein weiterer Abwärtsimpuls bis zum Tief vom 19. Dezember bei 1,77 US-Dollar wieder ein realistisches Szenario.
Autor  Mitrade Team
Mi. 28.Jan
• Bitcoin pendelt am Mittwoch um 89.000 US-Dollar und hat sich nach der Vorwochenkorrektur bislang um knapp 3% erholt – entscheidend bleibt die Zone um 87.787 US-Dollar. • Ethereum arbeitet sich an die Widerstandszone heran: Erst ein Tagesschluss über 3.017 US-Dollar und der 50-Tage-EMA bei 3.101 US-Dollar würde den Weg nach oben freimachen. • XRP prallt von 1,83 US-Dollar ab und steht wieder bei 1,90 US-Dollar – doch RSI und MACD sprechen weiter für Vorsicht. Nach der kräftigen Korrektur der vergangenen Woche setzt sich im Kryptomarkt eine vorsichtige Stabilisierung durch. Bitcoin, Ether und XRP bauen ihre Erholung aus, stoßen nun aber auf charttechnisch wichtige Marken, an denen sich entscheidet, ob aus der Gegenbewegung mehr wird – oder ob der nächste Rücksetzer folgt. Bitcoin: 87.787 US-Dollar bleibt der Dreh- und Angelpunkt Bitcoin hat am Montag nach der 7,48%-Korrektur der Vorwoche wieder oberhalb der Mittellinie eines horizontalen Parallelkanals bei 87.787 US-Dollar geschlossen. Am Dienstag verteidigte der Kurs diese Zone erneut, am Mittwoch notiert BTC bei rund 89.300 US-Dollar. Hält 87.787 US-Dollar als Support, rückt die obere Begrenzung des Musters bei 90.000 US-Dollar in den Fokus. Der RSI (Tag) liegt bei 45 und steigt in Richtung der neutralen 50 – ein Hinweis auf nachlassenden Verkaufsdruck. Auch der MACD entspannt sich: Die Linien nähern sich an, die roten Histogrammbalken unterhalb der Nulllinie werden schwächer. Bricht Bitcoin dagegen per Tagesschluss wieder unter 87.787 US-Dollar, bleibt die Unterseite anfällig – dann würde die nächste Auffangzone bei 85.569 US-Dollar (zugleich 78,6% Fibonacci-Retracement) wieder relevant. Ethereum: Erst über 3.017 und 3.101 US-Dollar wird es konstruktiver Ethereum startete positiv in die Woche und legte bis Dienstag um 7,62% zu – nach der 14,22%-Korrektur in der Woche davor. Am Mittwoch nähert sich ETH dem zentralen Widerstand bei 3.017 US-Dollar. Für ein klareres Erholungssignal braucht es mehr als nur Intraday-Stärke: Ein Ausbruch über 3.017 US-Dollar und ein Tagesschluss über dem 50-Tage-EMA bei 3.101 US-Dollar könnten den Blick in Richtung des Hochs vom 14. Januar bei 3.402 US-Dollar lenken. Die Momentum-Indikatoren (RSI und MACD) deuten zwar auf nachlassenden Abwärtsdruck hin, aber das Setup bleibt empfindlich. Kommt es stattdessen zu einer erneuten Abweisung an der Widerstandszone, rückt auf der Unterseite das 61,8% Fibonacci-Retracement bei 2.749 US-Dollar wieder ins Blickfeld. XRP: Rebound ja – Trendwende noch nicht XRP hat am Sonntag die tägliche Unterstützung bei 1,83 US-Dollar getestet und anschließend binnen zwei Tagen um 4,51% zugelegt. Am Mittwoch handelt der Kurs bei 1,90 US-Dollar. Solange 1,83 US-Dollar hält, kann sich die Erholung in Richtung des nächsten Widerstands bei 1,96 US-Dollar fortsetzen. Allerdings ist der Unterton noch nicht gedreht: Der RSI liegt bei 42 und damit weiter unter der neutralen 50. Zudem bleibt das Bild im MACD belastet – das bärische Crossover der Vorwoche ist weiterhin aktiv, was das Rückschlagrisiko erhöht. Fällt XRP per Tagesschluss erneut unter 1,83 US-Dollar, wäre ein weiterer Abwärtsimpuls bis zum Tief vom 19. Dezember bei 1,77 US-Dollar wieder ein realistisches Szenario.
placeholder
Solana unter Druck: SOL rutscht weiter ab und steuert auf Schlüsselstütze bei $116 zuSolana (SOL) fällt am Donnerstag rund 2% und nähert sich der Schlüsselstütze bei $116; sinkendes Open Interest ($7,42 Mrd.), negative Funding Rate (-0,0042%) und Long-Liquidationen erhöhen das Risiko eines Rutsches Richtung $100 und $95.
Autor  Mitrade Team
Do. 29.Jan
Solana (SOL) fällt am Donnerstag rund 2% und nähert sich der Schlüsselstütze bei $116; sinkendes Open Interest ($7,42 Mrd.), negative Funding Rate (-0,0042%) und Long-Liquidationen erhöhen das Risiko eines Rutsches Richtung $100 und $95.
placeholder
Cardano rutscht unter $0,36: Geopolitische Spannungen belasten RisikoassetsCardano (ADA) fällt am Donnerstag unter $0,36 und handelt bei $0,35; US-Iran-Spannungen und ein Long-to-Short-Ratio von 0,71 erhöhen das Risiko eines Tests von $0,32 (31. Dezember) und darunter $0,27 (10. Oktober).
Autor  Mitrade Team
Do. 29.Jan
Cardano (ADA) fällt am Donnerstag unter $0,36 und handelt bei $0,35; US-Iran-Spannungen und ein Long-to-Short-Ratio von 0,71 erhöhen das Risiko eines Tests von $0,32 (31. Dezember) und darunter $0,27 (10. Oktober).
placeholder
Gold fällt, da die Einigung über die Regierungsfinanzierung den USD stärkt und Gewinnmitnahmen auslöstGold (XAU/USD) erlebt am Freitag zum zweiten Mal in Folge eine starke Liquidation, nachdem es seit Beginn dieses Monats um mehr als 25% parabolisch gestiegen ist und in den letzten zwei Wochen eine Reihe von Rekordhochs erreicht hat.
Autor  FXStreet
Fr. 30.Jan
Gold (XAU/USD) erlebt am Freitag zum zweiten Mal in Folge eine starke Liquidation, nachdem es seit Beginn dieses Monats um mehr als 25% parabolisch gestiegen ist und in den letzten zwei Wochen eine Reihe von Rekordhochs erreicht hat.
verbundene Finanzinstrumente
goTop
quote