

US Dollar starts week on the back foot as traders expect large Fed interest-rate cut
- The Greenback sinks to a ten-day low despite a calm Monday start.
- Traders' eyes are on the Fed’s rate decision on Wednesday.
- The US Dollar Index could sink lower as it tests the lower bound of August’s bandwidth.
The US Dollar (USD) trades substantially softer on Monday ahead of the US opening bell. The move comes after traders seem to become increasingly convinced that the US Federal Reserve (Fed) will opt on Wednesday for a big interest-rate cut. This adds even more importance to the Fed meeting, where Fed Chairman Jerome Powell and his colleagues will need to make a decision on which is the right way to start the policy easing process: with a big or small rate cut.
On the economic data front, a slow start for the week in the runup to the Fed meeting on Wednesday. For Tuesday, the US Retail Sales data will be at the forefront in terms of market moving data. For this Monday, the NY Empire State Manufacturing Index for September will be the sole market-moving data point.
Daily digest market movers: Things just got ugly
- There was another possible assassination attempt over the weekend to kill former US President Donald Trump. The Federal Bureau of Investigation (FBI) was quick to foil the attempt and arrest the suspect, CNN reports.
- At 12:30 GMT, the New York Empire State Manufacturing Index for September is to be released. The main index is expected to increase slightly to -3.9 from -4.7 a month earlier.
- The US Treasury will auction a 3-month and a 6-month bill at 15:30 GMT.
- European equities are trading sideways while US futures are trading flat during European trading hours.
- The CME Fedwatch Tool shows a much smaller 41.0% chance of a 25 basis points (bps) interest rate cut by the Fed on Wednesday, further down from the 87% seen last week. Meanwhile, markets have increased the chances of a 50 bps cut to 59.0% on the back of Fed’s Dudley comments and the news articles last week. For the meeting on November 7, another 25 bps cut (if September is a 25 bps cut) is expected by 20.9%, while there is a 50.2% chance that rates will be 75 bps (25 bps + 50 bps) and a 29.0% probability of rates being 100 (25 bps + 75 bps) basis points lower compared to current levels.
- The US 10-year benchmark rate trades at 3.64%, still quite close to the 15-month low of 3.60%.
US Dollar Index Technical Analysis: Will it hold?
Whereas at the start of last week there were chances of the US Dollar Index (DXY) breaking above its upper band at 101.90, this Monday’s technical analysis needs to look at the possibility of the index snapping the lower band at 100.62. The seismic shift that some articles from the press and words from former NY Fed member William Dudley caused is leading to more downside pressure for the US Dollar as markets consider a 50 bps rate cut for both September and even for November. From a catalyst point of view, the current bandwidth should hold until the main event on Wednesday.
The upper level of the bandwidth for this week remains 101.90. Further up, a steep 1.2% uprising would be needed to get the index to 103.18. The next tranche up is a very misty one, with the 55-day Simple Moving Average (SMA) at 103.40, followed by the 200-day SMA at 103.89, just ahead of the big 104.00 round level.
On the downside, 100.62 (the low from December 28) holds strong and has already made the DXY rebound four times in recent weeks. Should it break, the low from July 14, 2023, at 99.58, will be the next level to look out for. If that level gives way, early levels from 2023 are coming in near 97.73.
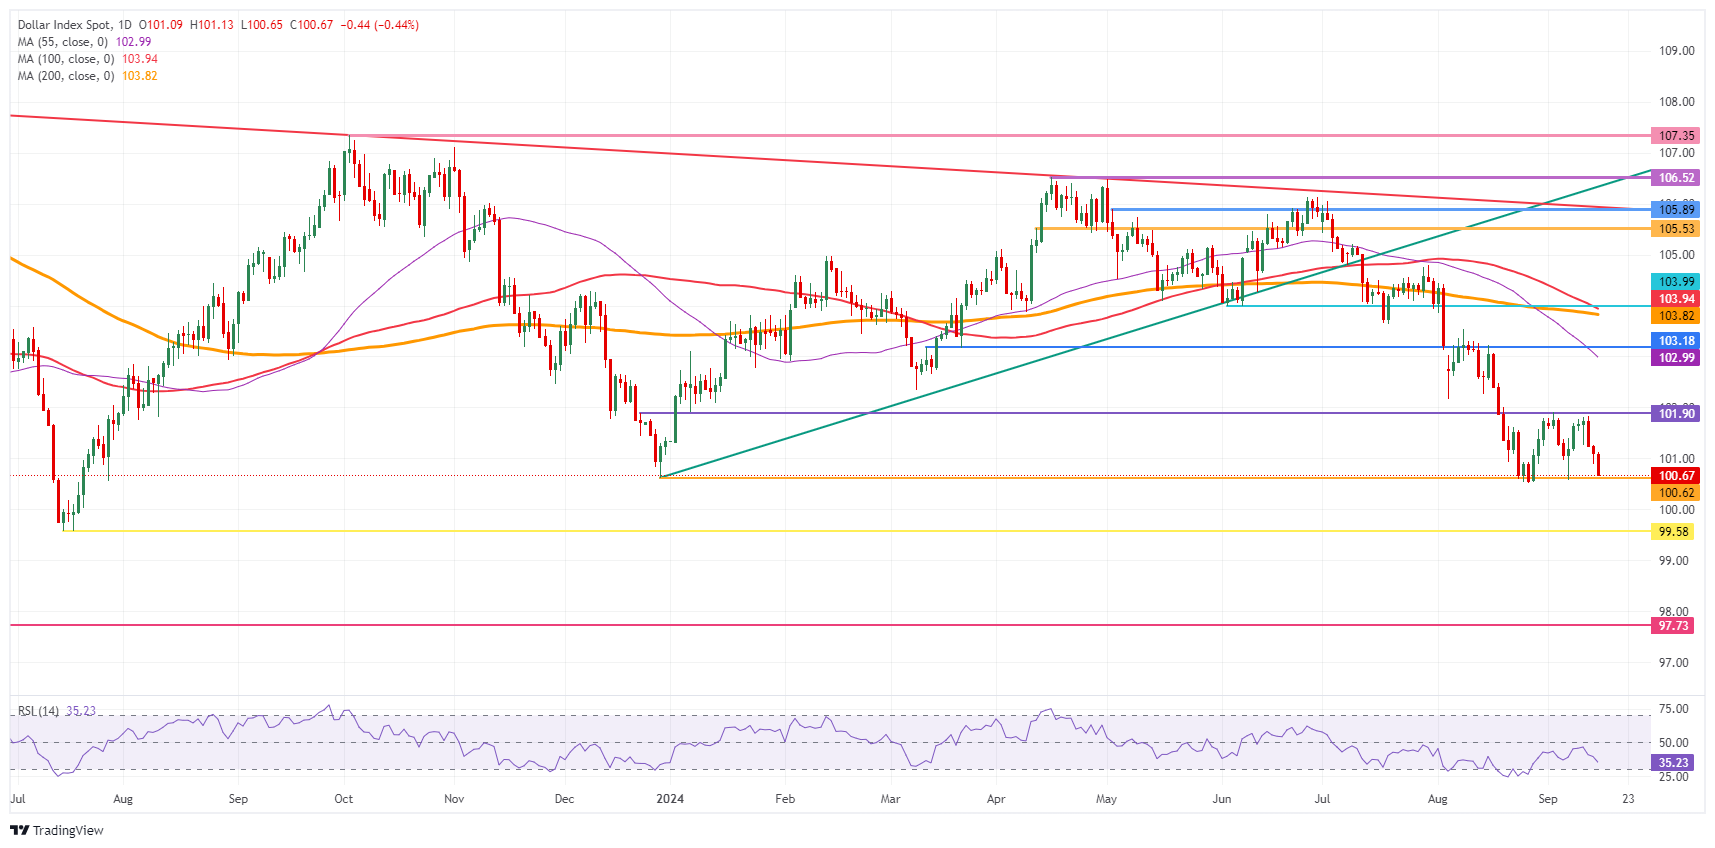
US Dollar Index: Daily Chart
US Dollar FAQs
The US Dollar (USD) is the official currency of the United States of America, and the ‘de facto’ currency of a significant number of other countries where it is found in circulation alongside local notes. It is the most heavily traded currency in the world, accounting for over 88% of all global foreign exchange turnover, or an average of $6.6 trillion in transactions per day, according to data from 2022. Following the second world war, the USD took over from the British Pound as the world’s reserve currency. For most of its history, the US Dollar was backed by Gold, until the Bretton Woods Agreement in 1971 when the Gold Standard went away.
The most important single factor impacting on the value of the US Dollar is monetary policy, which is shaped by the Federal Reserve (Fed). The Fed has two mandates: to achieve price stability (control inflation) and foster full employment. Its primary tool to achieve these two goals is by adjusting interest rates. When prices are rising too quickly and inflation is above the Fed’s 2% target, the Fed will raise rates, which helps the USD value. When inflation falls below 2% or the Unemployment Rate is too high, the Fed may lower interest rates, which weighs on the Greenback.
In extreme situations, the Federal Reserve can also print more Dollars and enact quantitative easing (QE). QE is the process by which the Fed substantially increases the flow of credit in a stuck financial system. It is a non-standard policy measure used when credit has dried up because banks will not lend to each other (out of the fear of counterparty default). It is a last resort when simply lowering interest rates is unlikely to achieve the necessary result. It was the Fed’s weapon of choice to combat the credit crunch that occurred during the Great Financial Crisis in 2008. It involves the Fed printing more Dollars and using them to buy US government bonds predominantly from financial institutions. QE usually leads to a weaker US Dollar.
Quantitative tightening (QT) is the reverse process whereby the Federal Reserve stops buying bonds from financial institutions and does not reinvest the principal from the bonds it holds maturing in new purchases. It is usually positive for the US Dollar.
Empfohlene Artikel


