Silver Price Forecast: XAG/USD steadies near $28 with US Inflation in focus

Quelle Fxstreet
  • Silver price hovers near $28.00 as investors shift focus to the US Inflation data for August.
  • Higher US Dollar and bond yields restrict the upside of the Silver price.
  • The Fed is widely anticipated to start reducing interest rates this month.

Silver price (XAG/USD) edges higher above $28.00 in Monday’s European session. The white metal trades in a tight range, with the downside remaining supported near $27.70. The upside in the Silver price remains restricted as the US Dollar (USD) and bond yields perform strongly as traders pare bets supporting the Federal Reserve (Fed) to start the policy-easing process aggressively this month.

The US Dollar Index (DXY), which tracks the Greenback’s value against six major currencies, surges to near 101.70. 10-year US Treasury yields soar to 3.75%. Historically, higher yields on interest-bearing assets ceil Silver’s upside, given that it increases the opportunity cost of holding an investment in non-yielding assets, such as Silver.

The US Dollar and bond yields strengthened after the release of the United States (US) Nonfarm Payrolls (NFP) data for August, which indicated that current labor market health is not as bad as it appeared from the official employment data of July.

Meanwhile, investors shift focus on the United States (US) Consumer Price Index (CPI) data for August, which will be published on Wednesday. The consumer inflation report is expected to show that monthly both headline and core CPI- which excludes food and energy prices- are estimated to have grown steadily by 0.2%. Annual headline CPI is expected to have decelerated sharply to 2.6% from July’s reading of 2.9%.

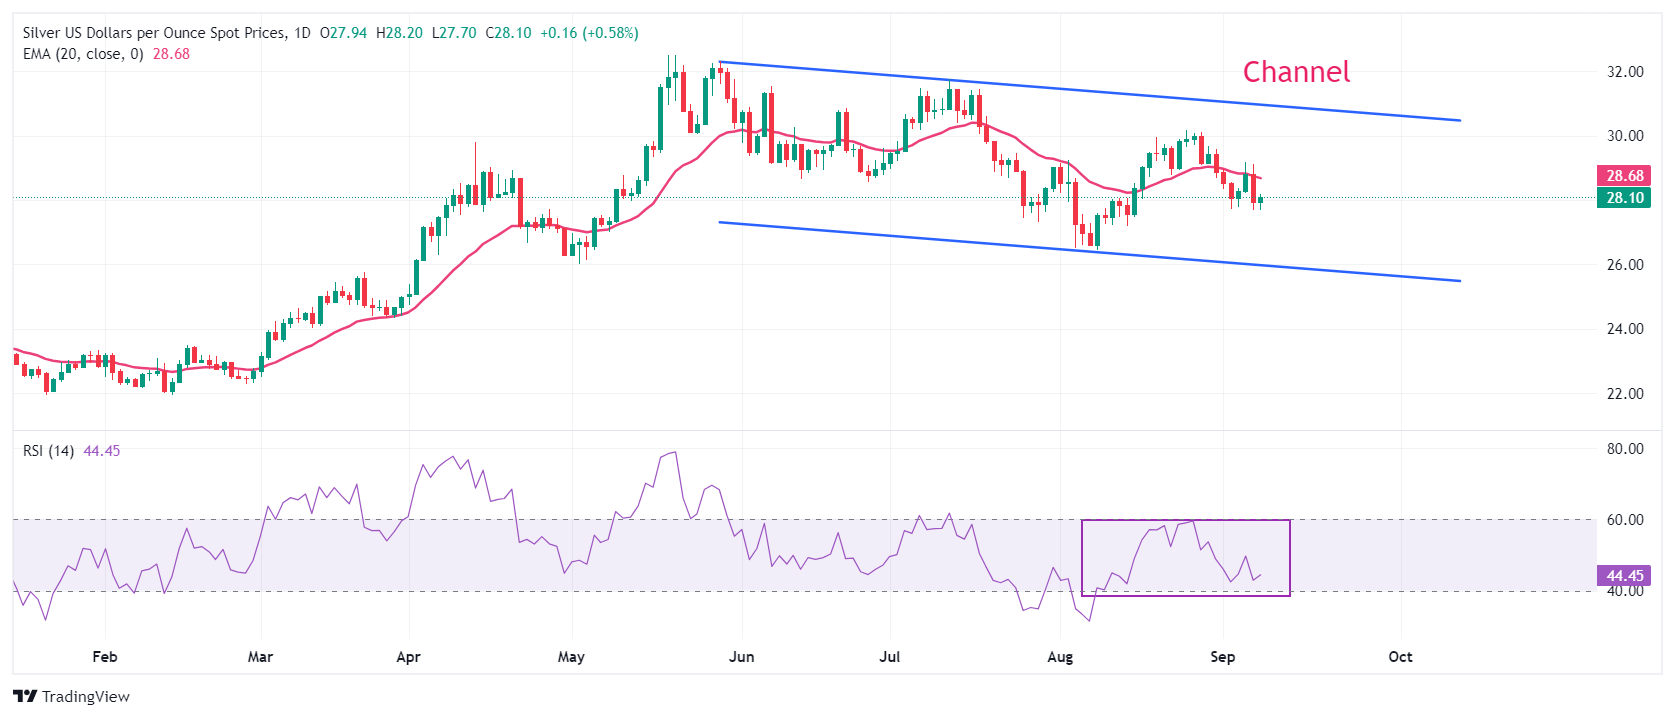
Silver technical analysis

 Silver price trades in a Channel formation on a daily timeframe, which is slightly sloping downwards. The asset recovers sharply and attempts to break above the 20-day Exponential Moving Average (EMA), which trades around $28.68.

The 14-day Relative Strength Index (RSI) oscillates inside the 40.00-60.00 range, suggesting a consolidation ahead.

Silver daily chart

Silver FAQs

Silver is a precious metal highly traded among investors. It has been historically used as a store of value and a medium of exchange. Although less popular than Gold, traders may turn to Silver to diversify their investment portfolio, for its intrinsic value or as a potential hedge during high-inflation periods. Investors can buy physical Silver, in coins or in bars, or trade it through vehicles such as Exchange Traded Funds, which track its price on international markets.

Silver prices can move due to a wide range of factors. Geopolitical instability or fears of a deep recession can make Silver price escalate due to its safe-haven status, although to a lesser extent than Gold's. As a yieldless asset, Silver tends to rise with lower interest rates. Its moves also depend on how the US Dollar (USD) behaves as the asset is priced in dollars (XAG/USD). A strong Dollar tends to keep the price of Silver at bay, whereas a weaker Dollar is likely to propel prices up. Other factors such as investment demand, mining supply – Silver is much more abundant than Gold – and recycling rates can also affect prices.

Silver is widely used in industry, particularly in sectors such as electronics or solar energy, as it has one of the highest electric conductivity of all metals – more than Copper and Gold. A surge in demand can increase prices, while a decline tends to lower them. Dynamics in the US, Chinese and Indian economies can also contribute to price swings: for the US and particularly China, their big industrial sectors use Silver in various processes; in India, consumers’ demand for the precious metal for jewellery also plays a key role in setting prices.

Silver prices tend to follow Gold's moves. When Gold prices rise, Silver typically follows suit, as their status as safe-haven assets is similar. The Gold/Silver ratio, which shows the number of ounces of Silver needed to equal the value of one ounce of Gold, may help to determine the relative valuation between both metals. Some investors may consider a high ratio as an indicator that Silver is undervalued, or Gold is overvalued. On the contrary, a low ratio might suggest that Gold is undervalued relative to Silver.


Haftungsausschluss: Nur zu Informationszwecken. Die bisherige Performance ist kein verlässlicher Indikator für zukünftige Ergebnisse.
placeholder
Aave-Ausblick: AAVE rutscht unter 186 US-Dollar – bärische Signale überlagern das Ende der SEC-ErmittlungAAVE fällt am Mittwoch auf 185,47 US-Dollar und bleibt trotz Abschluss der vierjährigen SEC-Untersuchung unter Druck, da Open Interest auf Binance auf 56,60 Mio. USD (nahe Jahrestief) sinkt und RSI (47) sowie ein drohendes MACD-Crossover bärisches Momentum signalisieren; unter 179,27 rückt 160,51 als nächster Support in den Fokus.
Autor  Mitrade Team
Mi. 17.Dez
AAVE fällt am Mittwoch auf 185,47 US-Dollar und bleibt trotz Abschluss der vierjährigen SEC-Untersuchung unter Druck, da Open Interest auf Binance auf 56,60 Mio. USD (nahe Jahrestief) sinkt und RSI (47) sowie ein drohendes MACD-Crossover bärisches Momentum signalisieren; unter 179,27 rückt 160,51 als nächster Support in den Fokus.
placeholder
Bitcoin und Ethereum mit Zickzack-Move: Heftige Liquidationen nach Vorwürfen möglicher MarktmanipulationBitcoin und Ethereum drehten am Mittwoch nach einem schnellen Anstieg (BTC 86.000→>90.000→~85.000; ETH 2.900→3.100→2.800) abrupt ins Minus und lösten laut Coinglass über 400 Mio. USD Liquidationen aus, während ETF-Abflüsse von >1 Mrd. USD (SoSoValue) und Kommentare von Amberdata auf fragile Marktstruktur und mögliche weitere Referenzzonen bei 80K/60K hinweisen.
Autor  Mitrade Team
Gestern 01: 00
Bitcoin und Ethereum drehten am Mittwoch nach einem schnellen Anstieg (BTC 86.000→>90.000→~85.000; ETH 2.900→3.100→2.800) abrupt ins Minus und lösten laut Coinglass über 400 Mio. USD Liquidationen aus, während ETF-Abflüsse von >1 Mrd. USD (SoSoValue) und Kommentare von Amberdata auf fragile Marktstruktur und mögliche weitere Referenzzonen bei 80K/60K hinweisen.
placeholder
Top Crypto Loser: Pump.fun, SPX6900 und Bittensor rutschen weiter ab – zweistellige Verluste bei hoher HebelbereinigungPump.fun (PUMP), SPX6900 (SPX) und Bittensor (TAO) gehören nach Liquidationen von über 500 Mio. USD zu den größten Krypto-Verlierern: PUMP fällt 12% und droht bei einem Schlusskurs unter $0.002000 aus dem fallenden Keil bärisch auszubrechen, SPX zielt Richtung $0.4375 (knapp 8% tiefer), und TAO verliert 10% in 24 Stunden mit Supports bei $222 und $200.
Autor  Mitrade Team
vor 23 Stunden
Pump.fun (PUMP), SPX6900 (SPX) und Bittensor (TAO) gehören nach Liquidationen von über 500 Mio. USD zu den größten Krypto-Verlierern: PUMP fällt 12% und droht bei einem Schlusskurs unter $0.002000 aus dem fallenden Keil bärisch auszubrechen, SPX zielt Richtung $0.4375 (knapp 8% tiefer), und TAO verliert 10% in 24 Stunden mit Supports bei $222 und $200.
placeholder
Cardano-Ausblick: ADA rutscht unter 0,37 US-Dollar – Zwei-Monats-Tief, während der Abwärtsdruck zunimmtCardano (ADA) fällt am Donnerstag unter 0,37 auf rund 0,36 US-Dollar (mehr als -7% diese Woche) und markiert ein Zwei-Monats-Tief, während On-Chain-Daten mit Social-Dominance-Jahrestief (0,032%) und steigender „Age Consumed“-Aktivität sowie negative Funding Rates (-0,0019%) auf wachsenden Verkaufsdruck hindeuten; technisch bleiben RSI 32 und ein bärischer MACD-Crossover belastend, mit 0,27 US-Dollar als nächster Support und 0,47 US-Dollar (50-Tage-EMA) als Erholungsziel.
Autor  Mitrade Team
vor 22 Stunden
Cardano (ADA) fällt am Donnerstag unter 0,37 auf rund 0,36 US-Dollar (mehr als -7% diese Woche) und markiert ein Zwei-Monats-Tief, während On-Chain-Daten mit Social-Dominance-Jahrestief (0,032%) und steigender „Age Consumed“-Aktivität sowie negative Funding Rates (-0,0019%) auf wachsenden Verkaufsdruck hindeuten; technisch bleiben RSI 32 und ein bärischer MACD-Crossover belastend, mit 0,27 US-Dollar als nächster Support und 0,47 US-Dollar (50-Tage-EMA) als Erholungsziel.
placeholder
Gold gibt in Asien leicht nach – trotz sinkender US-Inflation und wachsender ZinssenkungsfantasieGold fällt am Freitag in Asien unter $4,350, bleibt aber durch überraschend niedrige US-Inflation (CPI 2.7%, Kernrate 2.6%) und damit verbundene Fed-Senkungshoffnungen in 2026 gestützt, während der Michigan-Index, die FedWatch-Wahrscheinlichkeit von 26.6% für Januar und USA/Venezuela-Spannungen die kurzfristige Richtung bestimmen.
Autor  Mitrade Team
vor 3 Stunden
Gold fällt am Freitag in Asien unter $4,350, bleibt aber durch überraschend niedrige US-Inflation (CPI 2.7%, Kernrate 2.6%) und damit verbundene Fed-Senkungshoffnungen in 2026 gestützt, während der Michigan-Index, die FedWatch-Wahrscheinlichkeit von 26.6% für Januar und USA/Venezuela-Spannungen die kurzfristige Richtung bestimmen.
verbundene Finanzinstrumente
goTop
quote