

NZD/JPY Price Analysis: Bullish momentum remains, indicators gather strength

Quelle Fxstreet
  • The NZD/JPY rose by nearly 0.90% to 89.80 on Friday.
  • The RSI is in positive territory and rising, indicating buying pressure.
  • The MACD is showing rising green bars, suggesting increasing bullish momentum.

In Friday's session, the NZD/JPY continued its climb, propelled by a 0.90% rise to 89.80. This upward trajectory indicates that the pair is gaining strength following the recent consolidation above the 89.00 level. The pair is also riding a substantial winning streak and exhibiting signs of technical strength, amplifying the possibility of further advancements.

Examining the Relative Strength Index (RSI), it is currently positioned at 54, suggesting that buying pressure is elevated and remains a driving force behind the pair's momentum. Additionally, the Moving Average Convergence Divergence (MACD) is painting a bullish picture, with rising green bars indicating increasing bullish momentum.

NZD/JPY daily chart
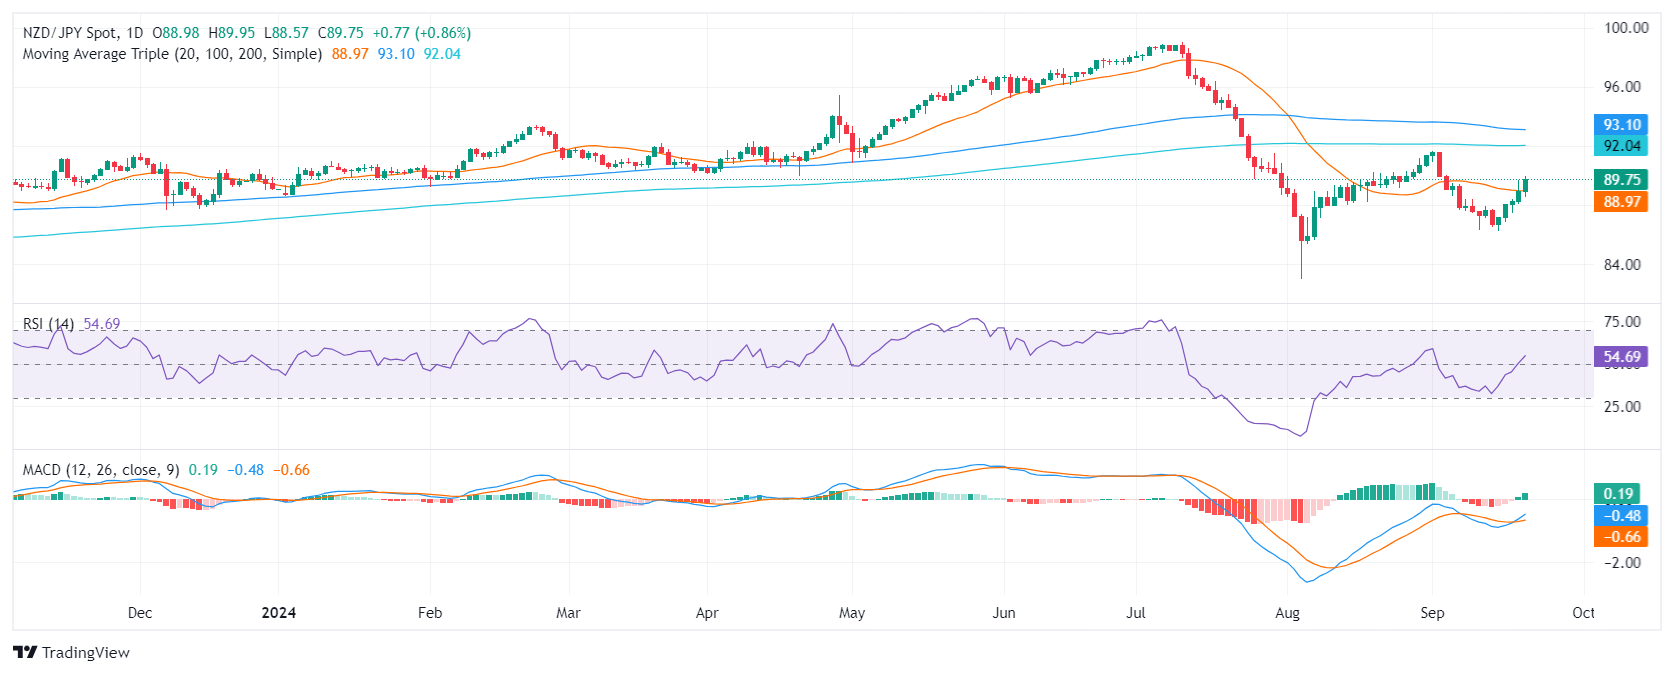
As for notable support and resistance levels, round support levels can be identified at 87.00, 86.50, and 86.00. Meanwhile, resistance levels can be found at 89.50, 90.00, and 90.50. The pair's breach past the 89.00 level has provided further confirmation of its bullish momentum, and sustained trading above this level could pave the way for a continued ascent..


Haftungsausschluss: Nur zu Informationszwecken. Die bisherige Performance ist kein verlässlicher Indikator für zukünftige Ergebnisse.
placeholder
Klimakiller KI: So plündern Big Techs unsere EnergiereservenInvesting.com – Der immense Stromverbrauch von Blockchains wie Bitcoin und Ethereum stand über viele Jahre hinweg im Fokus und wurde stets damit in Verbindung gebracht, wie umweltschädlich diese Techn
Autor  Investing.com
16.Jul. 2024
Investing.com – Der immense Stromverbrauch von Blockchains wie Bitcoin und Ethereum stand über viele Jahre hinweg im Fokus und wurde stets damit in Verbindung gebracht, wie umweltschädlich diese Techn
placeholder
Goldpreis-Prognose: Die Rally läuft, doch jetzt wird es für Bullen gefährlichDer Goldpreis kennt seit Monaten fast nur eine Richtung. Seit September 2025 ging es um rund 20 % nach oben, inzwischen notiert Gold bei 4.701,34 US-Dollar. Eigentlich ein Bild, das Anleger freuen müsste.
Autor  FXStreet
Mi. 26.Aug
Der Goldpreis kennt seit Monaten fast nur eine Richtung. Seit September 2025 ging es um rund 20 % nach oben, inzwischen notiert Gold bei 4.701,34 US-Dollar. Eigentlich ein Bild, das Anleger freuen müsste.
placeholder
Goldpreis vor Fed-Test – Diesel über 6 Dollar verschärft die LageDer Goldpreis steht vor dem dritten Wochenminus in Folge.
Autor  FXStreet
Mo. 14.Sep
Der Goldpreis steht vor dem dritten Wochenminus in Folge.
placeholder
Bitcoin Cash legt an einem einzigen Tag um 30 % zu, da Aufholrallye explodiert und BTC weit hinter sich lässtTradingKey – Bitcoin Cash startet Aufholrally: Sprung um 30 % an einem einzigen Tag und Annäherung an die 350-Dollar-Marke.Am 23. September verzeichnete Bitcoin Cash (BCH) einen kräftigen Kursanstieg,
Autor  Mitrade Team
Mi. 23.Sep
TradingKey – Bitcoin Cash startet Aufholrally: Sprung um 30 % an einem einzigen Tag und Annäherung an die 350-Dollar-Marke.Am 23. September verzeichnete Bitcoin Cash (BCH) einen kräftigen Kursanstieg,
placeholder
Bitcoin bricht im Tagesverlauf um 3 % ein, hält die Marke von 84.000 $ nur knapp: Geht die Talfahrt weiter?TradingKey – BTC bricht intraday um 3 % ein, da die Marke von 84.000 US-Dollar unter Druck gerät; wie weit wird dieser Rücksetzer gehen?Am 24. September gab Bitcoin (BTC) von einem Hoch bei rund 87.00
Autor  Mitrade Team
Do. 24.Sep
TradingKey – BTC bricht intraday um 3 % ein, da die Marke von 84.000 US-Dollar unter Druck gerät; wie weit wird dieser Rücksetzer gehen?Am 24. September gab Bitcoin (BTC) von einem Hoch bei rund 87.00
verbundene Finanzinstrumente
goTop
quote