NZD/JPY Price Analysis: Bullish momentum gains as bears failed to conquer the 20-day SMA

Quelle Fxstreet
  • The NZD/JPY's daily RSI reveals a transition towards positive territory, indicating a growing buying momentum.
  • Both daily and hourly MACD portray a neutral scenario with their flat green bars, neither favoring buyers nor sellers significantly.
  • Buyer's decisive support at the 20-day SMA in recent sessions indicates heightened bullish sentiment within the market.

The NZD/JPY rose to 91.59 on Monday and maintains a steady uptrend. Indicators on the daily and hourly charts are favoring the buyers and as the bears failed to breach the 20-day Simple Moving Average (SMA), the outlook remains positive for the short term.

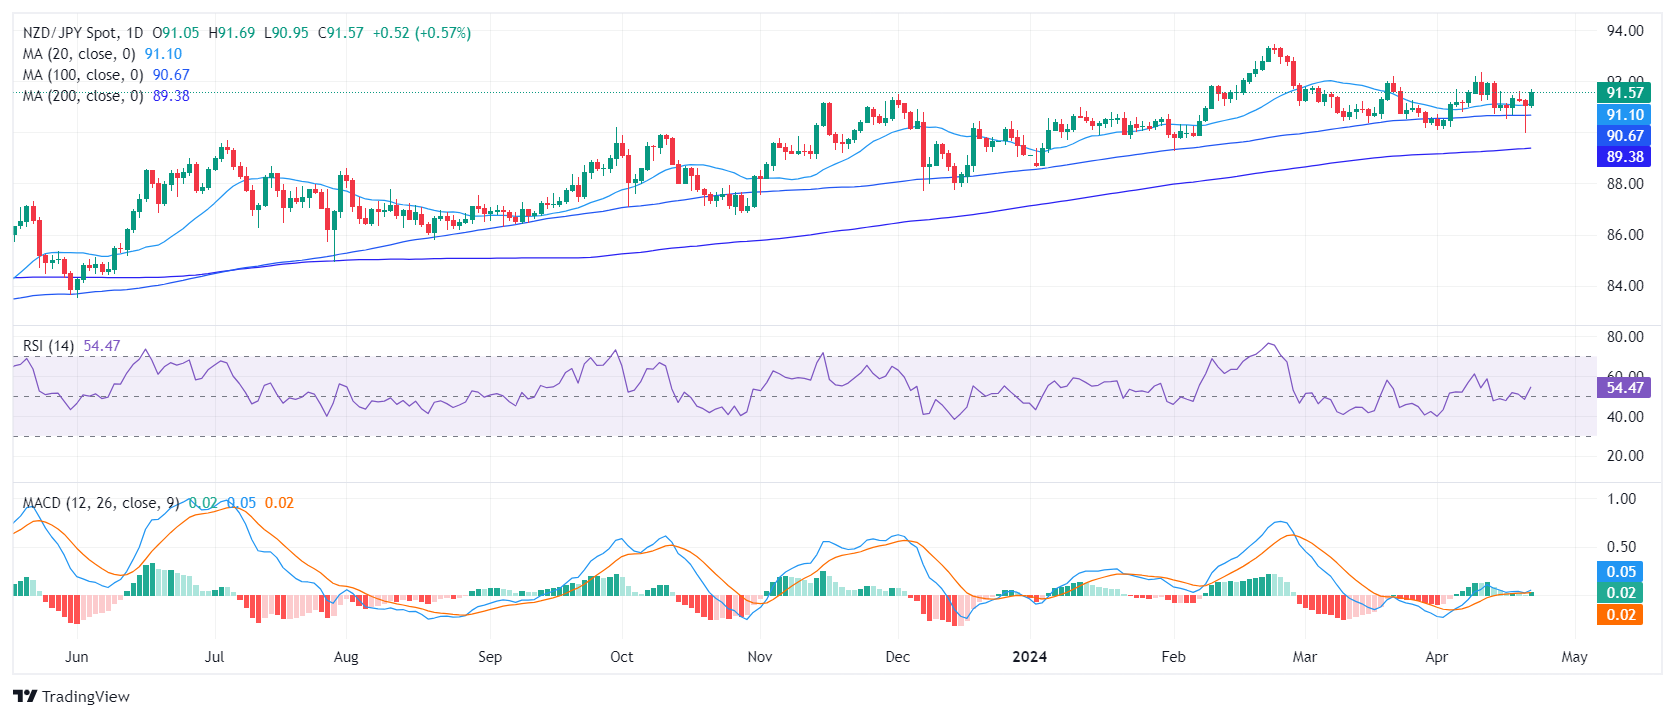
On the daily chart, the Relative Strength Index (RSI) reveals a transition from negative to positive territory, currently at 55. This shift shows a slight bullish momentum, indicating that traders are favoring more buying activities. The Moving Average Convergence Divergence (MACD) histogram exhibits flat green bars, suggesting a neutral momentum, neither favoring buyers nor sellers significantly.

NZD/JPY daily chart

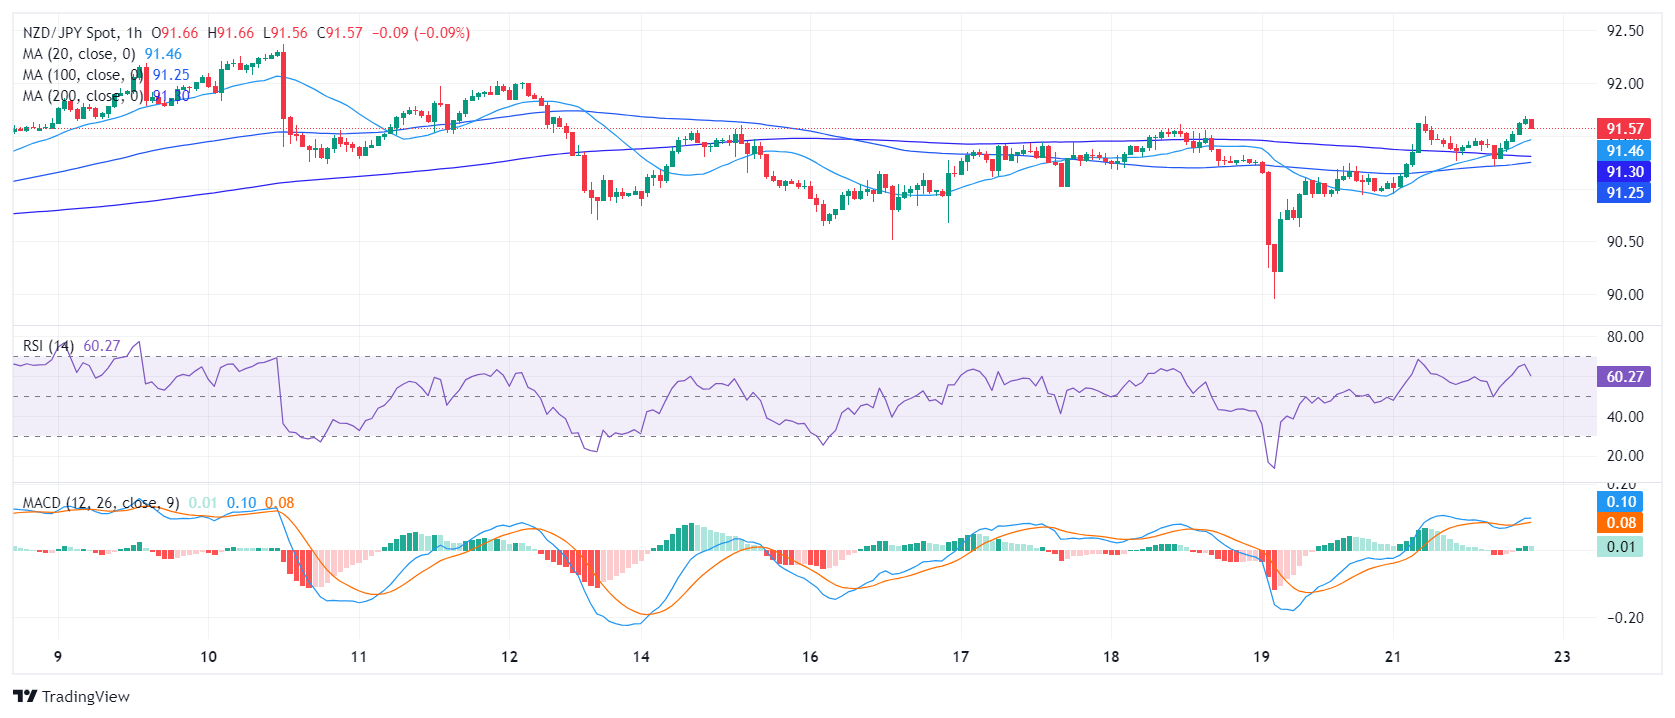
On the hourly chart, the RSI advances further into positive territory, peaking at 64 before slightly receding to 59. This movement signifies that buying activities have intensified during the American session. The MACD continues to exhibit flat green bars, mirroring the neutral momentum indicated on the daily chart.

NZD/JPY hourly chart

From a broader perspective, the NZD/JPY demonstrates a robust performance by situating above its key Simple Moving Averages (SMA), a technical indicator that averages the currency pair's closing prices over specific periods. Its stance above the 20, 100, and 200-day SMA suggests a consistent uptrend, representing both short-term and long-term strength. In the last sessions, the buyers defended the 20-day SMA at 91.10. This type of decisive support provides further evidence of a bullish sentiment among traders, which could stimulate more upside potential for the NZD/JPY.


NZD/JPY

Overview
Today last price 91.58
Today Daily Change 0.53
Today Daily Change % 0.58
Today daily open 91.05
 
Trends
Daily SMA20 91.07
Daily SMA50 91.42
Daily SMA100 90.67
Daily SMA200 89.36
 
Levels
Previous Daily High 91.32
Previous Daily Low 89.96
Previous Weekly High 91.62
Previous Weekly Low 89.96
Previous Monthly High 92.2
Previous Monthly Low 90.17
Daily Fibonacci 38.2% 90.48
Daily Fibonacci 61.8% 90.8
Daily Pivot Point S1 90.23
Daily Pivot Point S2 89.42
Daily Pivot Point S3 88.88
Daily Pivot Point R1 91.59
Daily Pivot Point R2 92.13
Daily Pivot Point R3 92.95


Haftungsausschluss: Nur zu Informationszwecken. Die bisherige Performance ist kein verlässlicher Indikator für zukünftige Ergebnisse.
placeholder
Klimakiller KI: So plündern Big Techs unsere EnergiereservenInvesting.com – Der immense Stromverbrauch von Blockchains wie Bitcoin und Ethereum stand über viele Jahre hinweg im Fokus und wurde stets damit in Verbindung gebracht, wie umweltschädlich diese Techn
Autor  Investing.com
16.Jul. 2024
Investing.com – Der immense Stromverbrauch von Blockchains wie Bitcoin und Ethereum stand über viele Jahre hinweg im Fokus und wurde stets damit in Verbindung gebracht, wie umweltschädlich diese Techn
placeholder
Goldpreis im Rückwärtsgang: US-Jobwunder lässt Zinshoffnungen für März schwindenXAU/USD fällt auf 5.050 Dollar. Starke US-Jobdaten (130k Stellen) dämpfen Zinshoffnung für März. Wichtige Chartmarken bei 5.144 und 4.757 Dollar.
Autor  Mitrade Team
Do. 12.Feb
XAU/USD fällt auf 5.050 Dollar. Starke US-Jobdaten (130k Stellen) dämpfen Zinshoffnung für März. Wichtige Chartmarken bei 5.144 und 4.757 Dollar.
placeholder
Midnight vor dem Start: Hoskinson kündigt Mainnet für März an – Google als Partner?NIGHT steigt auf 0,0500 Dollar nach Mainnet-Ankündigung für März. Hoskinson nennt Google als Partner. Charttechnischer Widerstand bei 0,0502 Dollar.
Autor  Mitrade Team
Do. 12.Feb
NIGHT steigt auf 0,0500 Dollar nach Mainnet-Ankündigung für März. Hoskinson nennt Google als Partner. Charttechnischer Widerstand bei 0,0502 Dollar.
placeholder
Goldpreis Prognose: 75 Prozent Rally! Droht jetzt der Absturz?Der Goldpreis hat Anleger in den vergangenen Monaten elektrisiert. Erst der Durchbruch über die magische Marke von 5.000 US-Dollar, dann neue Hochs – und jetzt der Dämpfer.
Autor  FXStreet
Mi. 25.Feb
Der Goldpreis hat Anleger in den vergangenen Monaten elektrisiert. Erst der Durchbruch über die magische Marke von 5.000 US-Dollar, dann neue Hochs – und jetzt der Dämpfer.
placeholder
WTI steigt aufgrund von Angriffen auf die Energieinfrastruktur im Nahen Osten auf fast 91,00 USDDer Preis für West Texas Intermediate (WTI) Öl erholt sich nach einem Verlust von über 9 % am Vortag und wird während der asiatischen Handelszeiten am Dienstag bei etwa 91,00 US-Dollar pro Barrel gehandelt
Autor  FXStreet
vor 1 Stunde
Der Preis für West Texas Intermediate (WTI) Öl erholt sich nach einem Verlust von über 9 % am Vortag und wird während der asiatischen Handelszeiten am Dienstag bei etwa 91,00 US-Dollar pro Barrel gehandelt
verbundene Finanzinstrumente
goTop
quote