


Gold Price Analysis Today: Gold Gains 0.94% as Markets Expect Fed to Hold Rates, Can $4,449 Resistance Break?


Gold Rate Today and Gold Live Chart
You might be interested in the following articles >>> XAUUSD Price Prediction 2026: Where Will It Land After the Historic Correction? How to Invest in XAUUSD in the UAE: All You Need to Know The Best 6 Gold Trading Platforms in the UAE for Year 2026: A Comprehensive Comparison of Gold Costs |
Early August 18 trading opened near $4,414, moved above the previous high, then reversed with a strong bearish 1-hour candle.
Gold remains supported by softer US data. July retail sales fell 0.6% versus expectations for a 0.1% increase, strengthening expectations that the Fed will keep rates unchanged in September, with markets now pricing only about a 35% chance of a rate increase.
The US dollar remains near multi-month lows, which supports gold, while the 10-year Treasury yield near 4.72% remains a counter-pressure. Renewed US-Iran tensions also support safe-haven demand.
Investors will watch August 18 housing and industrial-production data, followed by Wednesday’s Fed minutes. Weaker data could support gold by reinforcing expectations that rates will remain unchanged, while stronger data could increase expectations of higher rates and pressure prices.
Gold Rate Today in the UAE
Gold Rate Today in India
Gold Technical Analysis
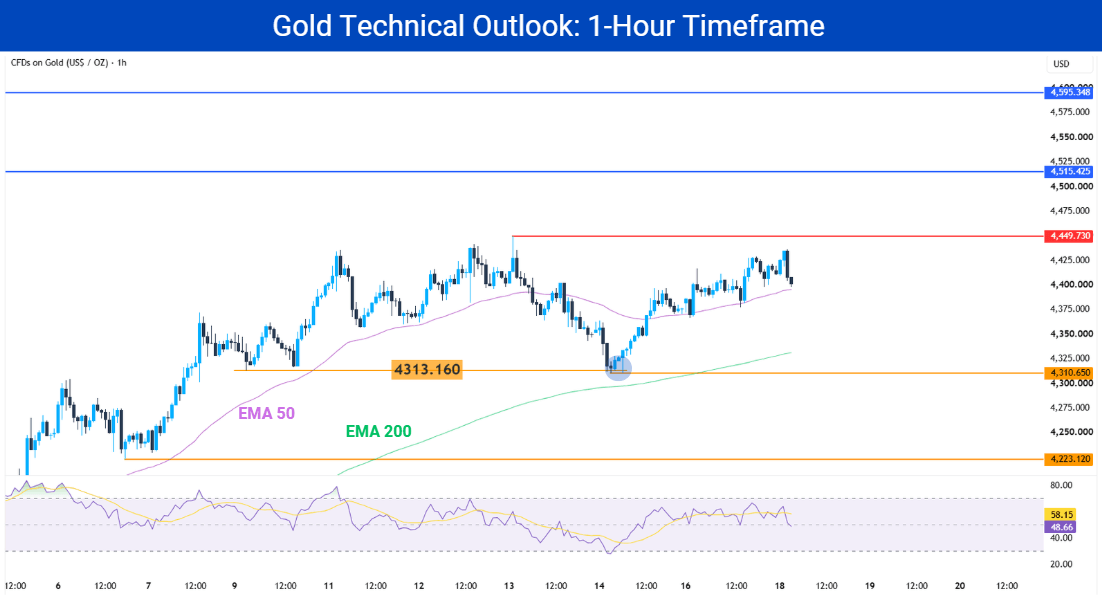
Gold remains bullish overall after reacting from the $4,313.160 support and moving higher, reclaiming the 50-period EMA. After that advance, price later established another support at $4,310.650.
Since reclaiming EMA50, price has reacted several times around the average, showing that it is acting as dynamic support during the current advance.
On August 18, gold moved above the previous session high before reversing with a strong bearish 1-hour candle. Price has not yet tested $4,449.730 and remains inside the $4,310.650–$4,449.730 range, while the overall trend remains bullish.
A confirmed break above $4,449.730 could open the way toward $4,515.425 and $4,595.348, both resistance levels from the daily timeframe. Until either side of the range breaks, the current price structure remains range-bound.
During a pullback, the main levels to monitor are:
EMA50: Currently acting as dynamic support. A decisive break below it would increase the probability of a deeper retracement.
EMA200: Represents a deeper pullback within the current uptrend and may attract buyers.
$4,310.650: Remains the main horizontal support. A confirmed break below it would temporarily shift the short-term bias bearish and expose $4,223.120.
If price reaches EMA200 or $4,310.650, traders should watch the reaction rather than assume support will automatically hold. A bullish candle combined with RSI approaching oversold conditions and then turning higher could provide stronger evidence that buyers are returning.
RSI is currently around 48.66 and below its 58.15 signal line, showing that short-term momentum has weakened during the current bearish reaction.
Resistance Levels to Watch
$4,449.730
$4,515.425
$4,595.348
Support Levels to Watch
200-period EMA
$4,310.650
$4,223.120
Should I Buy Gold Now?
Gold remains bullish overall, but price is still trading inside the $4,310.650–$4,449.730 range. Traders can approach the current structure differently depending on how much confirmation they require.
✅ Pullback traders: A deeper retracement toward the 200-period EMA or $4,310.650 could provide a buying opportunity if price shows a clear bullish reaction. A stop loss could be placed below $4,310.650, with $4,449.730 as the first upside target.
✅ Conservative traders: Conservative traders can trade either a pullback or a breakout but wait for additional confirmation before entering. This may include a strong bullish candle, RSI approaching oversold conditions and turning higher, stronger buying volume, or a supportive EMA crossover.
For a breakout, they can also wait for price to hold above $4,449.730 and successfully retest the level before entering.
✅ Breakout traders: A confirmed break above $4,449.730 followed by a successful retest could provide a buying opportunity toward $4,515.425 and then $4,595.348. A confirmed break below $4,310.650 followed by a failed retest could provide a selling opportunity toward $4,223.120.


Is It a Good Time to Buy Gold? Gold Prediction Today
The short-term gold price prediction remains bullish while $4,310.650 holds, although price is currently range-bound below $4,449.730. Expectations that the Fed will keep rates unchanged in September and a weaker dollar remain supportive, while higher Treasury yields continue to limit the upside.
The bullish scenario would strengthen with a confirmed break above $4,449.730. This could open the way toward the $4,515.425 daily resistance first, followed by $4,595.348 if buying momentum continues.
US housing and industrial-production data, followed by Wednesday’s Fed minutes, could influence this scenario. Weaker data could strengthen expectations that rates will remain unchanged and support gold, while stronger data or signs that the Fed may still raise rates could lift yields and the dollar.
The bearish scenario would become stronger if gold fails to extend higher and later breaks $4,310.650. Renewed upward pressure on Treasury yields or the dollar could add to selling pressure and expose $4,223.120.
For the gold prediction next week, Fed policy expectations, Treasury yields and the US dollar remain the main macro drivers. Continued US-Iran tensions could support safe-haven demand, while persistently high yields may limit further gains.

Trade XAU/USD with Tight Spreads
* The content presented above, whether from a third party or not, is considered as general advice only. This article should not be construed as containing investment advice, investment recommendations, an offer of or solicitation for any transactions in financial instruments.


