


Gold Price Prediction 2026: Where Will Gold Land After the Historic Correction?

Gold is one of the world’s oldest and most popular assets, used for centuries as a medium of exchange, store of value, and safe haven.
After a historic rally, gold surged to a record high of $5,598 per ounce in early 2026 before plunging into a 26% correction that briefly dragged prices below $4,000. Its next direction depends heavily on Fed policy, real yields, the US dollar, and global demand.
This gold price forecast examines recent fluctuations, key levels, 2026 drivers, analyst predictions, and where gold could move next.
Gold Price Today
Gold Price Live Chart for Today ▼
Gold was trading near US$4,120 per ounce on July 10, 2026, following several months of strong volatility. After a long-term rally, gold reached a historical high of approximately US$5,598 on January 29 before entering a major correction.
Gold briefly fell below US$4,000 in late June before recovering above US$4,100, although it remained approximately 26% below its January peak. These movements occurred alongside developments in the US–Iran conflict, changing ceasefire expectations and shifts in the Federal Reserve outlook.
Reviews and Analysis of Gold Prices for the Past Year
Gold’s performance over the past year can be divided into two broad phases. The first was a historic rally that carried the price to a new high. The second was a major correction marked by sharp declines, weaker recoveries and a gradual change in market structure.
The daily chart below divides this transition into six important stages.
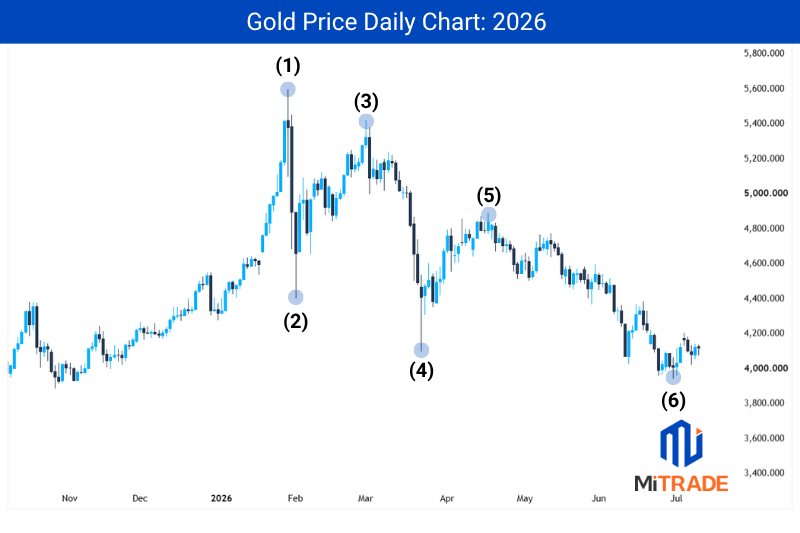
(1): January 29 – Historical high near US$5,598. Gold continued its strong rally and reached a new historical high near US$5,598 per ounce. However, the speed and size of the rally left the market vulnerable to profit-taking.
(2): February 2 – Sharp pullback toward US$4,402. During the three trading sessions following the historical high, gold dropped sharply and reached approximately US$4,402. Many buyers closed their profitable positions after the strong rally, while leveraged traders also reduced their exposure. This combination intensified the selling pressure.
(3): March 2 – Recovery toward US$5,419. Gold regained strength and climbed toward US$5,419, but it failed to break the January historical high. This created a lower high, showing that buyers had returned but had not regained complete control of the market.
(4): March 23 – Rejection near US$4,098. Gold dropped sharply, moved below the previous low and reached approximately US$4,098. However, the long lower wick showed that buyers reacted at lower prices. Because the candle did not close below the previous low, the movement represented rejection rather than a confirmed bearish breakdown.
(5): April 17 – Another lower high near US$4,890. Gold recovered again and reached approximately US$4,890, but the rebound remained below the March high. This formed another lower high, indicating that sellers were entering the market at progressively lower prices.
(6): Late June – Bearish break below the recent low. Gold moved below the recent low and closed beneath it. Unlike the temporary break in March, this close confirmed renewed bearish pressure. Price subsequently traded near US$3,942 on the chart, showing that the correction had extended further.
What Caused This Trend?
Gold’s long rally began in 2023 and continued until January 29, 2026, when the price reached a historical high near US$5,598 per ounce. After reaching this peak, the upward momentum stalled and gold entered a volatile correction marked by sharp pullbacks, temporary rebounds and progressively lower highs.
Gold’s long rally was supported by several forces that repeatedly increased demand for defensive assets:
Geopolitical uncertainty: The Russia–Ukraine war and conflicts in the Middle East encouraged investors to switch into gold as a safe-haven asset.
Economic and fiscal concerns: US tariff tensions, government debt, inflation fears and expectations of interest-rate cuts strengthened gold’s appeal as a store of value.
Central-bank and investment demand: Central-bank purchases, ETF inflows and speculative buying reinforced the upward momentum toward the January 2026 historical high.
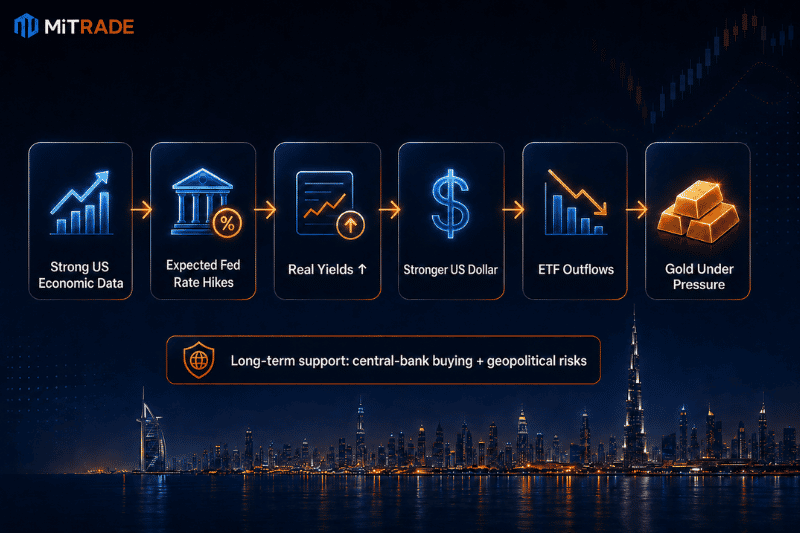
However, the rally eventually became overextended. After gold reached approximately US$5,598, the following reactions accelerated the correction:
Investors secured profits after the prolonged rally.
Speculative and leveraged traders liquidated positions.
The initial selling triggered stop-loss orders and further liquidations.
These reactions explain the rapid decline toward US$4,402. Central-bank and long-term buying later supported rebounds, but ETF outflows and changing interest-rate expectations weighed on gold’s recovery.
The US-Iran conflict and uncertainty around the Strait of Hormuz then created strong two-way volatility:
Bullish effect: Military escalation increased safe-haven demand and produced short-term gold rebounds.
Bearish effect: Threats to oil supplies lifted energy prices and inflation expectations, reducing expectations of Federal Reserve rate cuts.
Market effect: Higher bond yields and a stronger dollar increased pressure on non-yielding gold.
| 💡Conclusion: Consequently, escalations, ceasefire announcements and negotiations produced sharp movements in both directions. As expectations grew that the Federal Reserve would keep interest rates high or raise them further, gold formed lower highs before dollar strength, ETF outflows and continued profit-taking pushed it below US$4,000. |
Gold Technical Analysis: Key Levels to Watch
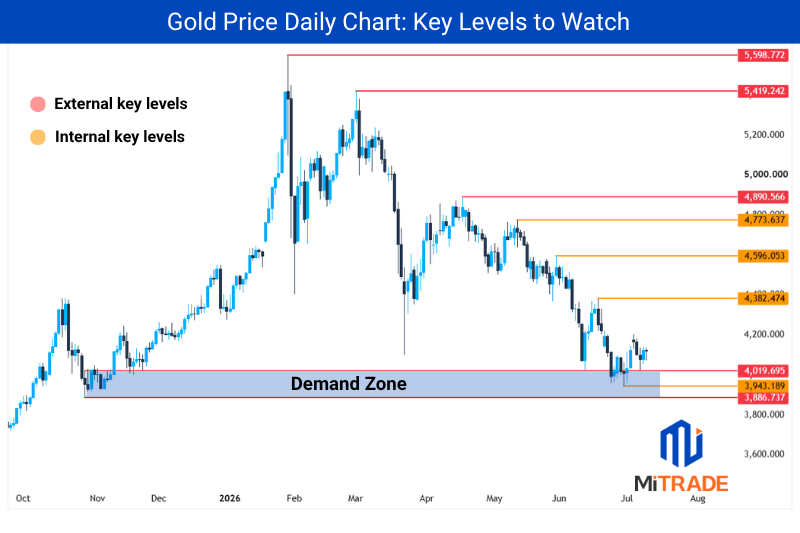
Gold is trading just above a major demand zone after its sharp 2026 correction. The chart separates external levels, which define the broader market structure, from internal levels, which can create shorter-term reactions within that structure.
Key Resistance
The main external resistance levels are:
(1) US$4,891: This is the April swing high and the first major external resistance. A strong daily close above it would break the recent sequence of lower highs and strengthen the recovery.
(2) US$5,419: This level marks the March high. Reclaiming it would show that buyers have recovered most of the correction and are approaching the historical peak.
(3) US$5,599: This is the January 2026 historical high and the strongest external resistance. A confirmed break above it would signal a new bullish breakout rather than a temporary rebound.
The internal resistance levels are US$4,382, US$4,596 and US$4,774. These levels are shorter-term barriers inside the broader range. A close above one level could open the way toward the next, while repeated rejection would show that sellers still control the recovery.
Key Support
The main demand zone extends from approximately US$3,887 to US$4,020. This is where buyers previously entered the market, making it the most important support area on the chart.
The key external support boundaries are:
(1) US$4,020: The upper boundary of the demand zone and the first major support. Holding above it would show that buyers are still defending the area.
(2) US$3,887: The lower boundary and the most important external support. A decisive daily or weekly close below it would break the demand zone and increase the risk of a deeper correction.
The internal support near US$3,943 sits inside the demand zone. A brief move below this level followed by a close back above it would indicate rejection, while repeated closes below it would show that the zone is weakening.
Traders should focus on how gold reacts around these levels rather than assuming that every touch will produce a reversal. External levels deserve the most attention because strong rejection or a confirmed close beyond them can change the broader market structure. Internal levels are more useful as shorter-term barriers and potential targets.
Factors That May Affect Gold Prices in 2026
Gold is currently bearish following its major correction from the January high. Its direction during the rest of 2026 will depend on interest rates, the US dollar, investment demand and geopolitical developments. Each factor can either support or pressure gold as conditions change.
These figures illustrate gold’s sensitivity to its main drivers, but they are not fixed predictions. Interest rates, currencies, investment flows and geopolitical risks interact, so the final price reaction may differ from the estimated effect of one factor in isolation.
Gold Price Forecast in 2026
Analysts remain divided after gold’s historic rally and sharp correction. Most still expect some recovery, but their latest targets are considerably more cautious because of higher real yields, a stronger dollar and uncertainty over Federal Reserve policy.
Latest Analyst Gold Price Forecasts
Gold Price Scenarios for the Rest of 2026
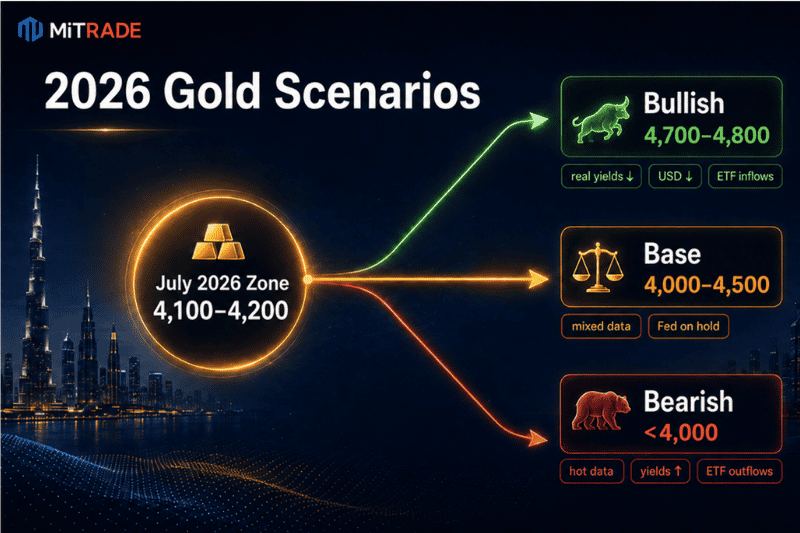
Our base case is a volatile consolidation between approximately $4,000 and $4,500 while markets reassess inflation, Fed policy and geopolitical risk.
These scenarios are not guaranteed. Their purpose is to show which market developments would support or invalidate each outlook.
As a Retail Investor, Can You Still Buy Gold Right Now?
Retail investors can still consider buying gold. The major correction has made gold significantly cheaper than at its January peak, creating opportunities to buy at lower prices. However, the correction may continue, so investors should not assume that gold has already reached its bottom and should adapt their strategy accordingly.
The following content is based on personal investing experience and does not constitute financial advice.
if you’re a beginner looking to capitalize on recent market volatility, keep this in mind: start small to test the waters and never add to positions blindly—emotional trading is the easiest way to blow up your account. Learn to use an economic calendar to track US data releases and back up your trading decisions.
If you are a short-term trader, you should focus on key support and resistance levels, observe how price reacts around them and wait for a confirmed rejection or breakout before entering. They can buy after bullish confirmation at support or sell after bearish confirmation at resistance, using the next level or area as a target. Remember, strict stop-losses are critical—it is recommended to cap your risk at 1% to 2% per single trade.
If you are a long-term investor, you should consider the 29% drop from gold’s peak, which can create opportunities to buy at lower prices. However, they should also prepare for the possibility that the correction continues and gold falls further. Entering gradually can reduce the risk of committing all their capital at one price.
If you are an Investor who is seeking to maximize returns can combine long-term gold exposure with tactical short-term trades. They may hold gold for the long term while using a smaller CFD short position during pullbacks to offset part of the losses. Closing the short when gold shows bullish signs allows them to maintain long-term exposure while potentially benefiting from short-term declines. However, this requires strong risk management skills.
Please Note:
(1) Gold can be just as volatile as stocks: Gold’s average annual volatility stands at 19.4%, compared to 14.7% for the S&P 500.
(2) Gold moves in very long cycles: While it succeeds as a store of value over a 10+ year horizon, it can easily double or be cut in half along the way (as seen in 2011–2015).
(3) Physical gold carries high transaction costs: These costs typically range from 5% to 20%, meaning frequent trading will eat away massive chunks of your profit. If you want to trade swings, consider highly liquid alternatives like gold ETFs or spot gold (XAU/USD).
Always trade with the trend, clarify your positioning (short-term, long-term, or asset allocation), and then decide on your entry strategy.


How to Capitalise on the Drop in Gold Prices on Mitrade for the UAE Investors?
Gold’s correction has created both sharp declines and temporary recoveries. Mitrade traders can combine its charting, execution and risk-management tools to analyse these movements and look for opportunities in both directions.
Analyse Gold and Trade in Both Directions
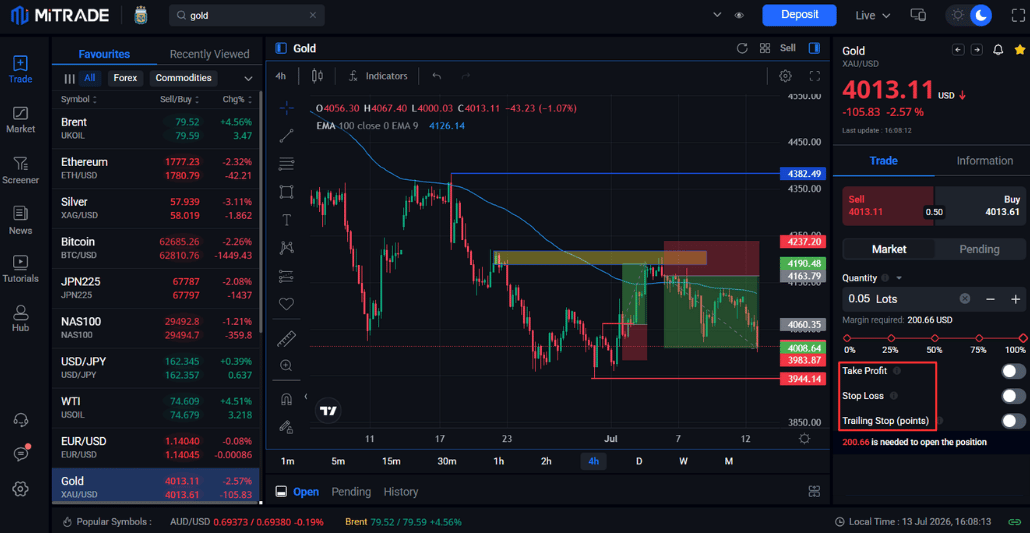
(1) Use Mitrade’s drawing tools and technical indicators, such as moving averages and volume, to analyse gold’s direction and mark important support, resistance and price areas. Set alerts at these levels so you are notified when gold reaches them.
(1) After price reaches an important area, wait to see whether it produces a breakout or reversal. Gold CFDs allow traders to open a long position after bullish confirmation or a short position after bearish confirmation, making it possible to take advantage of both upward and downward price movements.
(1) Always place stop-loss and take-profit orders at logical levels based on the setup. A stop loss can be placed beyond the area that invalidates the trade, while the next support or resistance can serve as a potential target. Mitrade also provides a trailing-stop option that can lock in part of the profit as gold moves toward the final target.
Watch News That Can Affect Gold Price
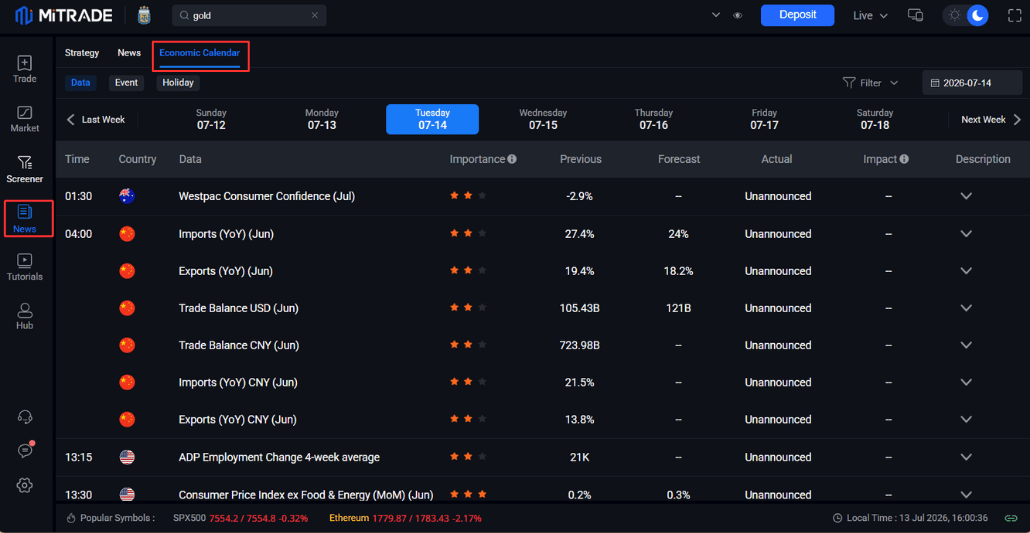
Use the economic calendar available on the same Mitrade platform to monitor events that can move gold, including inflation data, employment reports and Fed decisions. Events can be filtered by date, country and importance, helping traders focus on the releases most relevant to gold and prepare for possible volatility before entering a trade.
Conclusion
Gold’s 2026 outlook depends on whether Fed policy, yields and the dollar outweigh support from central banks and investment demand. Holding US$3,887 to US$4,020 could support a recovery, while a break below would confirm the bearish scenario.
Investors and traders do not need to predict one exact target. Monitoring price reactions, economic data, yields, ETF flows and the dollar can provide stronger confirmation of whether the bullish, bearish or range bound scenario is developing.
To navigate these shifting market conditions effectively, choosing a platform like Mitrade can give you a distinct advantage.
Mitrade provides you with:
✅ Flexible & Convenient Trading: 24/7 round-the-clock trading with support for local currency deposits and withdrawals.
✅ Low Barrier to Entry: User-friendly platform, zero-commission trading, low spreads, and trade sizes starting as low as 0.01 lot.
✅ Fund Security: Fully licensed and regulated, segregated funds, excess loss insurance, and negative balance protection.

Trade XAU/USD with Tight Spreads
* The content presented above, whether from a third party or not, is considered as general advice only. This article should not be construed as containing investment advice, investment recommendations, an offer of or solicitation for any transactions in financial instruments.


