


Bitcoin Price Prediction 2026-2030: 3 Scenarios for Short Term and Long Term

Bitcoin has shed nearly half its value in just ten months. Trading at around $64,900 on 9 August 2026, it remains far below its October 2025 record high of $126,080. But the story goes beyond price action: institutional demand has cooled markedly in 2026, leading several major forecasters to revise their Bitcoin outlooks.
In this guide, we examine the latest Bitcoin price predictions from leading institutions, break down the five key indicators shaping market momentum, and identify the catalysts that could shift the outlook in either direction.
Bitcoin Price Prediction at a Glance: 2026–2030
How might Bitcoin’s price evolve over the coming years? The table below compares projected price ranges and percentage changes from 2026 to 2030 under three scenarios: Base, Bull, and Bear.
Note: Price ranges reflect the latest published institutional forecasts available as of 6 August 2026. Probabilities are scenario estimates based on the market conditions discussed in this article.
What Do Bitcoin's Previous Market Cycles Tell Us?
Understanding these historical cycles helps investors assess whether today’s market resembles previous bull or bear phases, while showing what drove earlier turning points and providing essential context for any Bitcoin price prediction.
Note: The current cycle is ongoing, so its final drawdown is not yet known. Peak prices may vary slightly by exchange and data provider.
Bitcoin’s past market cycles show that strong bull markets can still be followed by substantial corrections, even as adoption, institutional participation, and market access expand. The catalysts have differed from one cycle to another, but liquidity, investor sentiment, regulation, and broader macroeconomic conditions have repeatedly influenced major turning points.
The key lesson is that historical cycles provide useful context for a Bitcoin price prediction, but they are not a precise roadmap for future prices. Investors should consider both the potential for further upside and the possibility of significant drawdowns when assessing the current cycle.
Short Term: Bitcoin Price Prediction for the Next 90 Days
Technical Analysis Outlook for Bitcoin Price
Over the next 90 days, Bitcoin remains in a consolidation phase, with the next sustained breakout likely to determine short-term direction.
Trend & Momentum: Bitcoin is trading around its 50-day average, while the 14-day RSI is near 55, a neutral reading that suggests neither buyers nor sellers have clear momentum.
Chart Structure: Price remains range-bound below the $66,000 area and under a descending trendline from the June highs. A sustained break above that level would strengthen the recovery case, while a move below $60,000 would put the recent lows back in focus.
Volume Analysis: Spot-market liquidity remains subdued, with centralized-exchange turnover still low. This lack of participation suggests the current recovery has not yet broadened into a strong expansion in demand and could make the next breakout more sensitive to changes in liquidity.

Source: Investing.com. Screenshot taken 24 August 2026.
Fear & Greed Index: The index stood at 29, or “Fear,” on 13 August 2026, showing that retail sentiment remains cautious despite recent stabilization.
Derivatives Market: Open interest and funding remain moderate, while directional participation has increased. Leverage is therefore building without reaching extreme levels, but a failure of key support could still trigger sharper liquidations.
Key Levels to Watch
Primary resistance: $67,500–$70,000. This zone combines the short-term holder cost basis with major technical resistance. A sustained break above it would strengthen the recovery case.
Immediate support: $61,000–$63,000. Around 515,000 BTC is concentrated near $63,000 and another 362,000 BTC near $61,000, making this one of the market’s strongest current cost-basis zones.
Critical support: around $58,000. A decisive break below the recent range floor would weaken the current consolidation structure and increase the risk of a deeper decline.
Next resistance: $78,000–$82,000. This is the largest supply concentration above the current price, so holders returning to profit could increase selling pressure there.
Short-Term Probability Table
The next 90 days can be framed around three scenarios based on Bitcoin’s technical structure, institutional flows and on-chain signals.
Note: Probabilities are scenario estimates based on the technical, institutional and on-chain signals discussed above; they are not published institutional forecasts.
Long Term Bitcoin Price Prediction 2026-2030
Institutional Bitcoin Price Predictions
Institutional Bitcoin forecasts remain unusually divided in 2026. Some analysts still expect a strong recovery before year-end, while others have cut their targets as ETF demand weakens and regulatory progress slows. The gap between forecasts shows how differently major institutions are interpreting the same market conditions.
Published Bitcoin forecasts vary widely across institutions and time horizons. The table below compares specific numerical targets from major banks, asset managers and digital-asset research firms through 2030.
Latest Institutional Bitcoin Price Forecasts
What Could Drive Bitcoin's Long-Term Value in the Future?
✅Sustained institutional demand. Continued growth in Bitcoin ETF holdings and broader institutional allocation through 2030 could create a durable source of demand. Persistent outflows, however, would weaken this support.
✅Slower supply growth. Bitcoin’s next halving is expected around 2028, reducing the rate at which new coins enter circulation. If demand continues to grow while new supply slows, scarcity could become more influential toward 2030.
✅Broader corporate adoption. More companies holding Bitcoin as a treasury asset could expand long-term demand. The effect will depend on whether corporate holdings continue to grow rather than being reduced during market downturns.
✅Greater government adoption. Wider use of Bitcoin by governments or sovereign institutions between now and 2030 could strengthen its status as a strategic asset. Limited adoption would leave this as a smaller part of the long-term valuation case.
✅Clearer regulation and market infrastructure. More defined rules for trading, custody and institutional participation could make Bitcoin easier for large investors to access through 2030. Restrictive regulation or prolonged legal uncertainty could have the opposite effect.
Bitcoin Price Prediction Scenarios
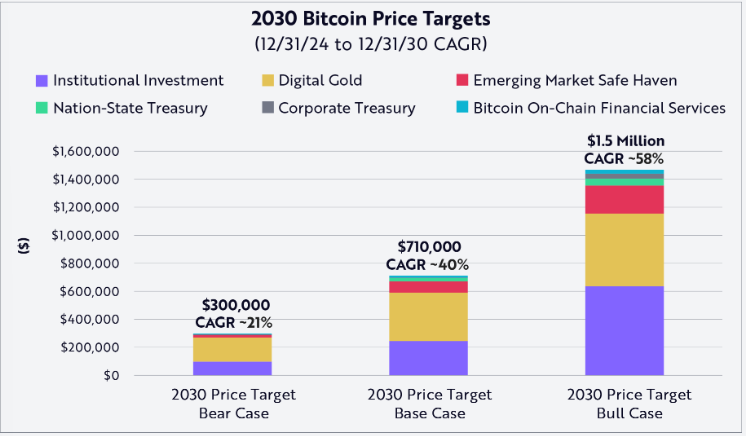
Bitcoin’s path from 2026 to 2030 will depend on how institutional demand, liquidity, regulation, and adoption develop over the next five years. The scenarios below, therefore, describe three possible trajectories across the full forecast period rather than focusing on a single year.
Bullish. In the bullish scenario, stronger institutional inflows, broader corporate and government adoption, improving liquidity and a supportive regulatory environment could accelerate Bitcoin’s recovery. The model places Bitcoin at 80,000–100,000 in 2026, rising to 110,000–160,000 in 2027, 150,000–220,000 in 2028, 220,000–350,000 in 2029, and 300,000–500,000 by 2030.
Base. The base scenario assumes gradual adoption rather than a new speculative surge, with uneven ETF demand and continued corrections along the way. Bitcoin could trade around 60,000–75,000 in 2026, 70,000–100,000 in 2027, 90,000–130,000 in 2028, 120,000–180,000 in 2029, and 160,000–240,000 by 2030.
Bearish. Prolonged weakness in institutional demand, tighter liquidity, recession risk or restrictive regulation could keep Bitcoin under pressure. The model allows for 48,000–58,000 in 2026, 40,000–60,000 in 2027, 55,000–80,000 in 2028, 65,000–100,000 in 2029, and a slower recovery toward 80,000–130,000 by 2030.
Note: These annual price ranges are analytical scenario estimates for this article, not published institutional forecasts.
Recommended Strategies for Investors: How to Manage the Risks Amidst Drastic Fluctuations?
✅For long-term investors: use a structured DCA plan. One approach is to allocate 70% of the intended Bitcoin capital to regular purchases and keep 30% in reserve for larger corrections, such as a 15%–20% drop below the 200-day moving average. DCA spreads purchases across different prices instead of relying on one entry point.
✅For swing traders: wait for confirmation. Enter only after price closes decisively outside the established trading range, then place the stop below the breakout level. Size the position so that a failed trade risks no more than 1%–2% of total account equity.
✅For short-term traders: define the loss before entering. Set the stop-loss level first, calculate the distance between entry and stop, and adjust the position size so the maximum loss remains within the chosen risk limit. Stop orders may execute at a worse price during fast markets.
✅For beginners: avoid leverage. Start with unleveraged positions and use only capital you can afford to expose to Bitcoin’s volatility. Leverage magnifies losses as well as gains and can trigger automatic liquidation when margin requirements are no longer met.

The 5 Indicators That Predict Bitcoin Better Than Headlines
Indicator 1: MVRV Z-Score
What is it? A measure of how far Bitcoin's market value has moved above or below its realized value, adjusted for historical variation.
Why is it important? Extreme readings have historically appeared around overheated markets and deep bear-market lows.
How to interpret it? Glassnode, a digital-asset market intelligence and on-chain analytics platform, associates high readings with overvaluation and low readings with undervaluation.
Current signal: about 0.42 in early August 2026, well below levels associated with overheated markets.
Indicator 2: Realized Price
What is it? The average acquisition price of Bitcoin, calculated from the price when each coin last moved.
Why is it important? It shows whether the market as a whole is holding an unrealized profit or loss.
How to interpret it? Trading below Realized Price has historically occurred during deep bear markets and around major bottoming periods.
Current signal: about $52,000 in early August 2026, roughly 20% below the current price.
Indicator 3: Exchange Reserve Trend
What is it? The amount of Bitcoin held on exchanges, where it is readily available for trading.
Why is it important? Lower exchange balances can mean less Bitcoin is immediately available for sale.
How to interpret it? Falling reserves have traditionally been viewed as supportive, but the signal is less reliable today.
Current signal: reserves remain near multi-year lows. CoinDesk notes that some of the decline reflects Bitcoin moving into ETFs and institutional custody rather than private long-term storage.
Indicator 4: Long-Term Holder Supply
What is it? Bitcoin is classified as being held long term, using a threshold centered around 155 days.
Why is it important? These holders have historically been less sensitive to short-term price movements.
How to interpret it? A rising figure can indicate reduced market turnover, but does not necessarily mean new accumulation.
Current signal: long-term holder supply reached a record 15.8 million BTC in late May. CryptoQuant cautioned that some of the increase reflects coins simply ageing into the category rather than fresh conviction buying.
Indicator 5: Global M2 Money Supply
What is it? M2 is a broad measure of money supply that includes cash and readily accessible deposits. “Global M2” combines similar measures across major economies.
Why is it important? Greater liquidity can support demand for risk assets, although the relationship with Bitcoin is not consistent.
How to interpret it? Rising M2 can provide a supportive backdrop, but it should not be treated as a direct Bitcoin price signal.
Current signal: US M2 reached $23.16 trillion in June 2026, 5.53% higher than a year earlier.
Bitcoin Price Prediction Model: Build Your Own Bitcoin Forecast in 5 Steps
Step 1: Macro
Start with the economic backdrop. Check interest-rate direction, inflation, economic growth and global liquidity. Falling rates and improving liquidity are generally more supportive for risk assets, while tightening conditions deserve a lower score.
Step 2: On-chain
Compare several on-chain indicators rather than relying on one. MVRV Z-Score, Realized Price, exchange reserves and long-term holder supply can show whether Bitcoin appears overheated, undervalued, accumulated or distributed.
Step 3: Technical
Assess price against major moving averages, support and resistance levels, RSI and trading volume. Strong momentum above key resistance deserves a higher score; weakening momentum or a break below support deserves a lower one.
Step 4: Risk
Identify what could invalidate the forecast. Consider volatility, leverage, regulatory changes, recession risk and major market shocks. Apply a larger deduction when downside risks are unusually high.
Step 5: Results
Score the main factors, then combine them into one result. Macro, ETF demand, on-chain and technical conditions can each receive 0–25 points, while risk can deduct up to 10 points.
As a simple rule, a total of 65 or above can indicate a Bullish outlook, 40–64 a Neutral outlook, and below 40 a Bearish outlook. Recalculate the model whenever the underlying indicators change.
FAQs
1. Will Bitcoin replace gold?
Not on current evidence. Central banks and official institutions hold nearly 39,000 tonnes of gold, worth about $5 trillion, and account for around 18% of all above-ground gold. Bitcoin serves some similar store-of-value purposes, but Grayscale notes that it is “not a perfect substitute for physical gold.”
2. Is Bitcoin still a good investment?
Yes, Bitcoin can still be a good investment for investors with a long time horizon and a high tolerance for risk. Its long-term return potential remains significant, but so does its volatility, and sharp losses can occur even during broader growth cycles. It is therefore better suited to investors who can tolerate substantial price swings and avoid relying on short-term gains.
3. What is the Bitcoin price target for the end of 2026?
Institutional expectations differ widely. Bernstein forecasts $150,000 by end-2026, while Standard Chartered targets $100,000. Citi’s separate 12-month forecast is $82,000.

 $0 Commission, Tight Spreads, Min. Deposit $501:1-1:200 Fexible leverage with support24*5 customer support serviceOne account to access global markets
* The content presented above, whether from a third party or not, is considered as general advice only. This article should not be construed as containing investment advice, investment recommendations, an offer of or solicitation for any transactions in financial instruments.


