


Gold Price Analysis Today: Gold Rebounds After 1.91% Drop as Yields Ease. Is $4,449 Next?


Gold Rate Today and Gold Live Chart
You might be interested in the following articles >>> XAUUSD Price Prediction 2026: Where Will It Land After the Historic Correction? How to Invest in XAUUSD in the UAE: All You Need to Know The Best 6 Gold Trading Platforms in the UAE for Year 2026: A Comprehensive Comparison |
On August 18, gold opened at $4,417.60, rose to $4,436, then fell to $4,329.50 before closing at $4,333.40, losing about 1.91%. Early August 19 trading entered the 1-hour demand zone and produced a strong bullish candle as buyers reacted to the decline.
The selloff came against a backdrop of elevated global bond yields and high oil prices, while US economic data were mixed. July single-family housing starts fell 9.9%, while manufacturing output rose 0.2%. Early August 19, the 10-year Treasury yield eased to 4.702% and the dollar index remained near multi-month lows at 99.65, providing some support for gold.
Markets currently price a 65% chance that the Fed will keep rates unchanged in September and a 35% chance of an increase. Investors now await the Fed minutes, while continued US-Iran uncertainty keeps oil prices elevated. Geopolitical risk can support safe-haven demand, but higher energy prices may keep inflation and interest-rate concerns elevated.
Gold Rate Today in the UAE
Gold Rate Today in India
India gold rates were little changed from the previous session.
Gold Technical Analysis - 19th, August
Gold remains under short-term pressure following the August 18 decline, but the strong bullish 1-hour candle from the demand zone shows that buyers have started reacting. Supertrend remains bearish at around $4,379.680 and is still positioned above price, so the rebound is not yet a confirmed short-term trend reversal.
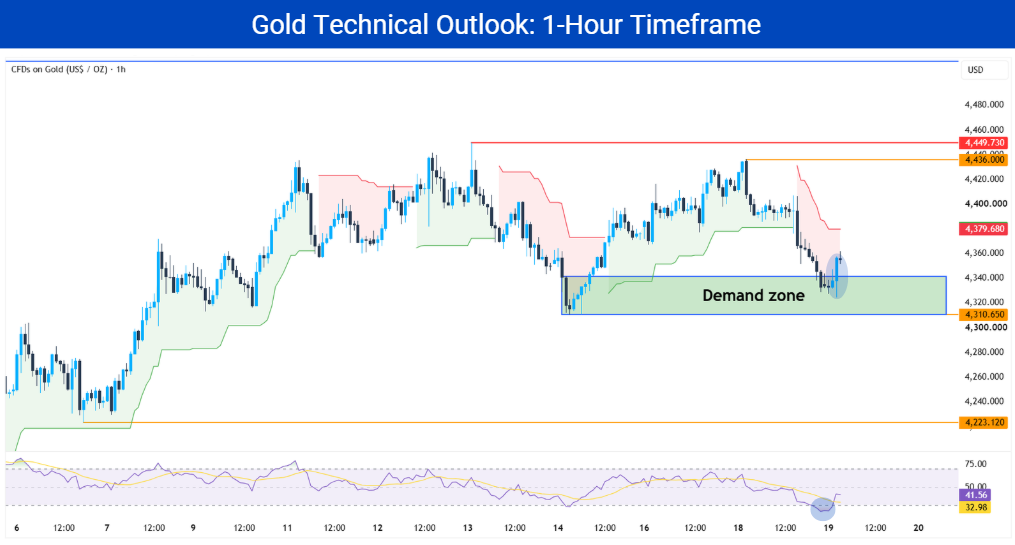
RSI fell below 30 during the selloff, reaching oversold territory before reversing sharply to 41.33. It has also moved above its 32.96 signal line, indicating that selling momentum is easing and giving additional confirmation to the bullish reaction.
The RSI recovery is constructive, but it remains below the neutral 50 level. A continued rise through 50 would show stronger buying momentum, while a turn lower could indicate that the rebound is losing strength.
Supertrend has not yet switched bullish, leaving trend confirmation behind the improving momentum signal. A bullish Supertrend shift would strengthen the case that the current reaction is developing into a broader short-term recovery rather than remaining a temporary bounce.
For reactions or breaks around important price areas, a clear confirming candle, stronger volume and a successful retest can provide additional confirmation before an entry.
Resistance Levels to Watch
$4,436
$4,449.730
$4,515.425
Support Levels to Watch
$4,341.500
$4,310.650
$4,223.120
Should I Buy Gold Now?
Gold is showing an early bullish reaction from the demand zone, supported by the strong bullish candle and RSI recovery from oversold conditions. However, Supertrend remains bearish, so traders may approach the setup differently depending on the level of confirmation they require.
✅ Pullback traders: The current demand-zone reaction may provide a buying opportunity if bullish price action continues. A stop loss can be placed below the demand zone, with $4,436 as the first target and $4,449.730 as the second.
If buyers push through $4,449.730, the recovery could extend toward the $4,515.425 daily resistance. If the current rebound fails and gold falls toward $4,310.650, a fresh bullish candle from that support could provide another buying opportunity.
✅ Conservative traders: Conservative traders may wait for multiple confirmations before buying. A bullish EMA crossover or Supertrend turning bullish could provide that confirmation, while stronger buying volume and a clear bullish candle can add confidence to the setup.
This approach may lead to a later entry and therefore reduce potential profit, but it is more conservative and carries less risk.
✅ Breakout traders: A confirmed break above $4,449.730 followed by a successful retest could provide a buying opportunity toward $4,515.425. Traders should avoid relying only on the first breakout candle and look for confirmation that price can hold above the broken resistance.
On the downside, a confirmed break below $4,310.650 followed by a failed retest could provide a selling opportunity toward $4,223.120. Stronger volume and bearish candlestick confirmation would strengthen the breakdown scenario.


Is It a Good Time to Buy Gold? Gold Prediction Today
The short-term gold price prediction is cautiously bullish following the strong reaction from the demand zone and RSI recovery from oversold conditions. However, the bearish Supertrend shows that the recovery still requires additional confirmation.
The bullish scenario could first take gold toward $4,436. A move above that resistance would bring $4,449.730 into focus, while a confirmed breakout could open the way toward the $4,515.425 resistance on the daily timeframe.
The Fed minutes are the main fundamental event to watch today. Signs that policymakers are comfortable keeping rates unchanged could support gold, particularly if Treasury yields continue easing and the dollar remains weak. Renewed expectations for higher rates could instead pressure the recovery.
The bearish scenario would strengthen if gold breaks below $4,310.650. A confirmed breakdown and failed retest could extend the decline toward $4,223.120.
For the gold prediction next week, Fed rate expectations, Treasury yields and the US dollar remain the main drivers. Softer yields and a weaker dollar would favor recovery, while renewed increases in yields could limit gold’s upside.

Trade XAU/USD with Tight Spreads
* The content presented above, whether from a third party or not, is considered as general advice only. This article should not be construed as containing investment advice, investment recommendations, an offer of or solicitation for any transactions in financial instruments.


