



The PCE Price Index is the Federal Reserve’s preferred inflation metric, making it a critical focus for traders and investors. Because it directly shapes expectations around Fed policy, major releases can trigger sharp market moves. Mastering PCE data helps traders interpret underlying inflation trends and position themselves for market volatility.
🎯This guide explains what PCE is, why it matters, and how it can support trading and investment decisions.
What Is the PCE Price Index?
The Personal Consumption Expenditures (PCE) Price Index measures the average change in prices paid by US consumers for goods and services over time. It is one of the most important indicators of inflation in the United States.
Unlike some inflation measures that focus only on what households purchase directly, the PCE Price Index also includes certain goods and services paid for on behalf of consumers, such as healthcare expenses covered by employers or government programs. This broader coverage gives policymakers a more complete view of inflation across the economy.
The chart below illustrates how annual PCE inflation has changed in the United States between 2016 and 2026:
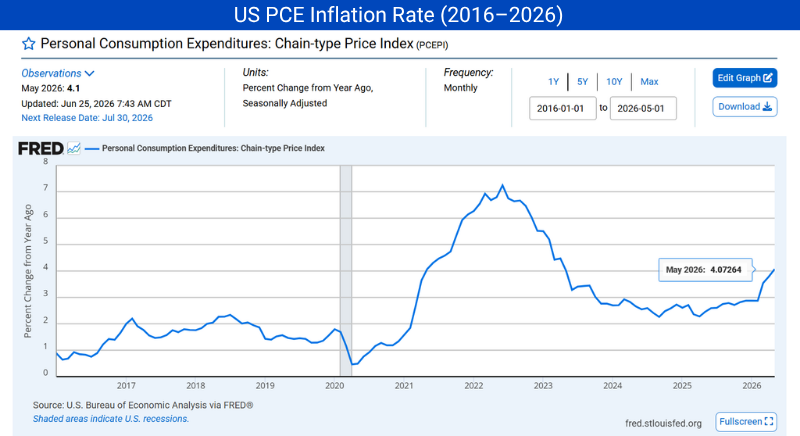
Source: Federal Reserve Bank of St. Louis (FRED), using US Bureau of Economic Analysis (BEA) data.
A faster increase in the PCE Price Index indicates rising inflation pressure, while a slower increase suggests that inflation is easing.
💡 Understanding PCE Inflation: A Simple Example
The PCE Price Index doesn’t track a single grocery item or one household's bills. Instead, it acts as a giant economic camera, taking a snapshot of total spending across every household in the United States.
How PCE Works (The Weighted Basket)
Imagine the average American household spends its monthly budget across four main categories:
🛒 Groceries: 30% of spending
⛽ Fuel & Transport: 20% of spending
🩺 Healthcare: 40% of spending
👕 Clothing: 10% of spending
If healthcare prices jump significantly while clothing prices drop slightly, PCE balances these based on how much money Americans actually spend in each area. If overall prices across this total spending basket end up 3% higher this year compared to last year, the Annual PCE Inflation Rate is 3%.
Types of PCE
Although investors often refer simply to "PCE," the monthly report contains several measures that provide different insights into inflation.
Understanding the difference between them helps investors interpret market reactions more accurately.
Among these measures, Core PCE often receives the greatest short-term market attention because it excludes volatile food and energy prices. Headline PCE remains important because it shows the full change in prices across consumer spending.
When Is the Next US PCE Data Release? 2026 PCE Release Schedule
The next US PCE data will be released at 4:30 p.m of September 30, 2026 (GST). It is generally released near the end of each month at 8:30 a.m. Eastern Time (ET) and is closely watched for its impact on inflation and interest-rate expectations. Higher-than-expected inflation may support expectations that the Fed will keep rates elevated, while lower-than-expected inflation may increase expectations for future rate cuts.
The PCE Price Index is released as part of the BEA’s Personal Income and Outlays report. UAE traders can use the Mitrade Economic Calendar to confirm the latest schedule and monitor forecasts, previous readings, actual results, and expected impact, as the release may increase volatility in the US dollar, gold, and US indices.
How Is the PCE Price Index Calculated?
Rather than relying on a static set of goods, the PCE Price Index evolves alongside consumer spending patterns. For example, when rising beef prices lead households to substitute chicken, the PCE accounts for this adjustment. As a result, it delivers a more comprehensive view of cost-of-living changes over time.
The calculation involves several steps:
Step 1: Collect Consumer Spending Data
The BEA collects information from businesses, government agencies, and other sources to measure purchases made by and on behalf of US consumers.
Step 2: Measure Price Changes
The BEA compares the prices of thousands of goods and services with previous periods to determine whether they have risen or fallen.
Based on the latest quarterly BEA breakdown available in July 2026, the approximate shares of total PCE spending in Q1 2026 were:
Food: 13.3%
Housing: 15.7%
Transportation: 8.8%
Healthcare: 20.9%
Recreation: 9.0%
Financial services: 5.7%
Education: 1.7%
Clothing, footwear, and related services: 2.8%
Utilities and household fuels: 2.5%
Step 3: Adjust Spending Weights
The BEA updates category weights as spending habits change. If consumers spend less on fuel and more on healthcare, the influence of each category also changes.
Step 4: Calculate the Overall Inflation Rate
The BEA combines the price changes with the updated spending weights to calculate and publish monthly and annual PCE inflation rates.
Simplified Formula
The official PCE Price Index uses a complex chain-weighted calculation. The simplified formula below illustrates how categories with larger spending shares can have more influence on the overall result.
PCE Inflation Rate ≈ Σ (Category Weight × Price Change)
where:
* Category Weight = the share of consumer spending on that category.
* Price Change = the percentage increase or decrease in that category's prices.
Simple Example of a PCE Calculation
The example below illustrates how categories with larger spending shares can have more influence on the overall result.
PCE Inflation Rate ≈ (45% × 3.0%) + (30% × 2.5%) + (25% × 4.0%) ≈ 1.35% + 0.75% + 1.00% = 3.10%
In this example, the estimated PCE inflation rate is 3.10%. Housing makes the largest individual contribution because it represents the largest share of spending.
What Are the Factors Influencing the PCE Price Index?
PCE inflation reflects several forces that affect consumer prices across the economy. The five main factors are:
1. Consumer Spending
When consumer spending rises, demand for goods and services may increase. If businesses cannot meet that demand, they may raise prices, pushing PCE inflation higher.
2. Wages and Employment
Higher employment and wages can support household spending. Businesses may also raise prices when labor costs increase, although stronger productivity can reduce this effect.
3. Housing and Healthcare Costs
Housing and healthcare represent large shares of PCE spending. Changes in rents, insurance, medical services, and healthcare paid by employers or government programs can strongly affect the index.
4. Energy and Commodity Prices
Oil, natural gas, electricity, and food commodity prices can quickly affect Headline PCE. Higher energy costs may also increase transportation and production expenses.
5. Supply Conditions and Economic Policy
Shipping delays, product shortages, tariffs, government spending, and interest-rate changes can affect business costs and consumer demand. Depending on their impact, these factors may cause prices to rise or fall over time.
What Are the Differences Between PCE and CPI?
Both PCE and CPI measure US consumer inflation, but they differ in coverage, data sources, and calculation.
Coverage: CPI mainly tracks expenses paid directly by urban consumers. PCE also includes spending paid on their behalf, such as employer- or government-funded healthcare.
Spending weights: PCE adjusts its category weights as consumer spending changes. CPI uses a basket whose weights are updated periodically.
Consumer substitution: PCE better reflects when consumers reduce purchases of a more expensive product and choose another option.
Data sources: PCE relies mainly on business and government data, while CPI relies more heavily on household surveys and collected retail prices.
Category importance: PCE generally gives healthcare a larger share and housing a smaller share than CPI.
Use: The Federal Reserve uses overall PCE for its 2% inflation objective, while CPI is commonly used to track changes in household living costs.
These differences mean PCE and CPI may report different inflation rates even when they measure the same period.
Why Does the Fed Prefer PCE to CPI?
Both PCE and CPI measure changes in consumer prices, but the Fed uses PCE for its official 2% inflation objective. PCE covers a wider range of spending and better reflects changes in what consumers buy.
✅ PCE Covers More Consumer Spending
CPI mainly measures expenses paid directly by urban consumers. PCE also includes goods and services purchased on their behalf, such as healthcare paid by employers or government programs.
✅PCE Reflects Changes in Spending
PCE updates its category weights as consumer spending patterns change. For example, when consumers buy less of one product and choose another, PCE reflects that change in spending.
✅PCE Uses Broader Source Data
PCE spending estimates rely mainly on data from businesses and government agencies, while CPI weights rely more on household spending surveys. This gives PCE broader coverage of consumer spending across the economy.
How Does the PCE Price Index Influence the Financial Markets?
Markets move when PCE data diverges from market forecasts. A higher- or lower-than-expected reading immediately shifts Federal Reserve interest-rate expectations, driving sharp swings in stocks, currencies, and commodities like gold.
Here is how financial markets typically react based on the outcome:
1. US Dollar
Higher-than-expected PCE may support the US dollar because it can reduce expectations for near-term interest-rate cuts. Lower PCE may pressure the dollar by increasing expectations for easier monetary policy.
Higher PCE may pressure gold if it strengthens the US dollar and pushes Treasury yields higher. Lower PCE may support gold by reducing yields and increasing expectations for interest-rate cuts.
3. US Treasury Bond Prices
Higher PCE may push Treasury yields higher and bond prices lower as investors expect interest rates to remain elevated. Lower PCE may reduce yields and support bond prices.
Higher PCE may pressure stocks, particularly growth and technology shares, because elevated rates can increase financing costs and reduce valuations. Lower PCE may support the stock market.
Higher PCE may pressure cryptocurrencies by reducing expectations for easier financial conditions and weakening demand for riskier assets. Lower PCE may improve market sentiment and support crypto prices.
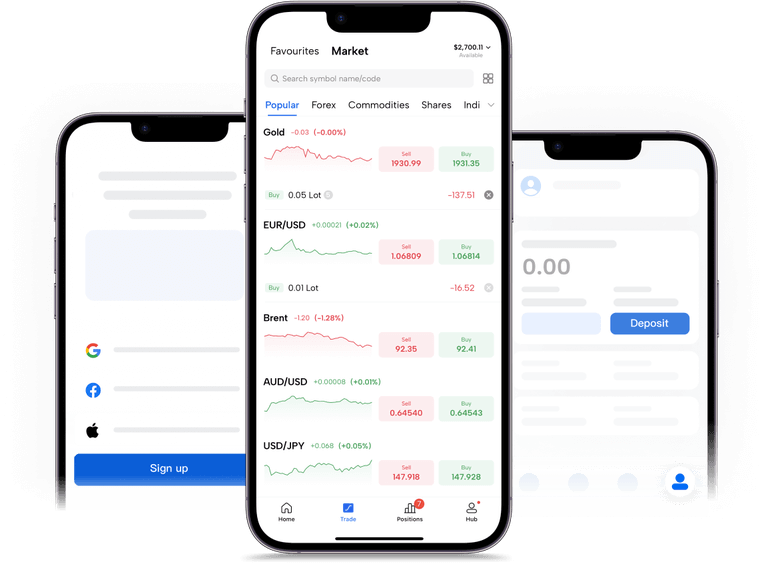
Major PCE releases often create high-impact trading opportunities across multiple markets. With a single Mitrade account, you can easily trade stocks, forex, gold, and cryptocurrencies—allowing you to go Buy (Long) or Sell (Short) based on your market outlook.

How to Decode a PCE Report?
A PCE report includes several figures that may send different signals. Start with the surprise versus forecasts, then examine the time period, inflation measure, spending categories, and revisions.
1. Compare the Actual Reading With the Forecast and Previous Reading
Higher-than-expected PCE may raise interest-rate expectations, support Treasury yields and the US dollar, and pressure gold and stocks. The previous reading helps show whether inflation is rising, falling, or remaining stable.
2. Distinguish Between Annual and Monthly Changes
Annual PCE measures price changes over the previous 12 months, while monthly PCE shows recent momentum. Annual inflation may fall because of base effects even when prices continue to rise from one month to the next.
3. Compare Headline PCE With Core PCE
Headline PCE includes food and energy, while core PCE excludes these volatile categories. A rise driven mainly by energy may be temporary, whereas stronger core PCE may indicate broader inflation pressure.
4. Examine Spending Categories, Their Shares, and Revisions
Categories with larger shares of consumer spending have more influence on the index. Also check whether earlier readings were revised, as a significant revision can change the inflation trend and help explain an unexpected market reaction.
How Should Investors Utilize PCE When Making a Strategy?
As the Federal Reserve’s preferred inflation gauge, the Personal Consumption Expenditures (PCE) price index is a crucial beacon for portfolio strategy. Here is how to position your investments across different inflation scenarios using PCE data:
1. When PCE Inflation Is Rising
Review exposure to growth stocks and highly indebted companies that may be affected by prolonged high interest rates.
Favor companies with stable demand, strong cash flow, and the ability to pass higher costs to customers.
Consider shorter-duration bonds if Core PCE and Treasury yields continue to rise.
Maintain sufficient liquidity and avoid making major changes based on one report.
2. When PCE Inflation Is Falling
Reassess growth and technology stocks that may benefit from lower interest-rate expectations.
Consider increasing bond duration gradually if PCE, rate expectations, and Treasury yields are all falling.
Monitor rate-sensitive sectors such as real estate, utilities, and consumer durables.
Require confirmation from several PCE reports before making major portfolio changes.
3. When Headline and Core PCE Send Different Signals
A rise in Headline PCE driven mainly by food or energy may be temporary.
Stronger Core PCE may indicate broader and more persistent inflation pressure.
Investors should identify which categories are driving the change before adjusting their portfolios.
4. Check Personal Income and Spending
Strong consumer spending alongside higher Core PCE may suggest that inflation pressure could continue.
Weaker spending combined with falling PCE may indicate slower demand and increase expectations for lower interest rates.
5. Confirm the Trend Before Adjusting
Avoid changing a portfolio based on one PCE release.
Look for confirmation across several PCE reports, Treasury yields, and Federal Reserve guidance.
Adjust exposure gradually while maintaining diversification, liquidity, and clear risk limits.
Conclusion
The PCE Price Index helps investors assess US inflation, Federal Reserve expectations, and potential movements in the US dollar, gold, bonds, and equities. Investors should compare the actual result with forecasts, review Headline and Core PCE, check revisions, and avoid reacting only to the first market move.
You can better prepare for volatility and make more informed decisions using the Mitrade Economic Calendar. It lets you track PCE releases in real time, filter events by country and market impact, and instantly compare live results with previous and forecasted data—helping you manage risk and trade economic volatility with confidence.

* The content presented above, whether from a third party or not, is considered as general advice only. This article should not be construed as containing investment advice, investment recommendations, an offer of or solicitation for any transactions in financial instruments.


